| Issue |
A&A
Volume 554, June 2013
|
|
|---|---|---|
| Article Number | L4 | |
| Number of page(s) | 4 | |
| Section | Letters | |
| DOI | https://doi.org/10.1051/0004-6361/201321649 | |
| Published online | 05 June 2013 | |
Direct detection of the tertiary component in the massive multiple HD 150136 with VLTI
1 Instituto de Astrofísica de Andalucía (CSIC), Glorieta de la Astronomía S/N, 18008 Granada, Spain
e-mail: This email address is being protected from spambots. You need JavaScript enabled to view it.
2 European Southern Observatory, Karl-Schwarzschild-Stra β e 2, 85748 Garching, Germany
e-mail: This email address is being protected from spambots. You need JavaScript enabled to view it.
3 Departamento de Física, Universidad de la Serena, Benavente 980, 204000 La Serena, Chile
4 Max – Planck – Institut für Astronomie, Königstuhl 17, 69117 Heidelberg, Germany
Received: 5 April 2013
Accepted: 15 May 2013
Abstract
Context. Massive stars are of fundamental importance for almost all aspects of astrophysics, but there still exist large gaps in our understanding of their properties and formation because they are rare and therefore distant. It has been found that most O-stars are multiples. It may well be that almost all massive stars are born as triples or higher multiples, but their large distances require milliarcsecond angular resolution for a direct detection of the companions.
Aims. HD 150136 is the nearest system to Earth with >100 M⊙ and provides a unique opportunity to study an extremely massive system. Recently, evidence for the existence of a third component in HD 150136, in addition to the tight spectroscopic binary that forms the main component, was found in spectroscopic observations. Our aim was to image and obtain astrometric and photometric measurements of this component using long-baseline optical interferometry to further constrain the nature of this component.
Methods. We observed HD 150136 with the near-infrared instrument AMBER attached to the ESO VLT Interferometer, which provides an angular resolution of 2 mas. The recovered closure phases are robust to systematic errors and provide unique information on the source asymmetry. Therefore, they are of crucial relevance for both image reconstruction and model fitting of the source structure.
Results. The third component in HD 150136 is clearly detected in the high-quality data from AMBER. It is located at a projected angular distance of 7.3 mas, or about 13 AU at the line-of-sight distance of HD 150136, at a position angle of 209 degrees east of north, and has a flux ratio of 0.25 with respect to the inner binary. Our findings agree with previous results and have permitted us to improve the orbital solutions of the tertiary around the inner system.
Conclusions. We resolved the third component of HD 150136 in J, H and K filters. The luminosity and color of the tertiary agrees with the predictions and shows that it is also an O main-sequence star. The small measured angular separation indicates that the tertiary may be approaching the periastron of its orbit. These results, only achievable with long-baseline near-infrared interferometry, constitute the first step toward understanding the massive star formation mechanisms.
Key words: instrumentation: high angular resolution / binaries: general / instrumentation: interferometers / stars: massive
© ESO, 2013
1. Introduction
The chemical composition of the universe cannot be fully understood without understanding the formation and evolution of high-mass stars. In every stage of the massive star life cycle, they dominate the stellar feedback to the interstellar medium. They may both trigger and disrupt star formation, mainly by the chemical enrichment produced by their strong stellar winds and the final supernova explosions that put an end to their lives. However, in spite of their importance, our knowledge about these objects and their evolution is still fragmentary. This is principally because they spend a significant part of their main-sequence lifetime while still embedded in their natal clouds, where the high extinction makes it difficult to observe their initial phases.
One of the most striking features of massive stars is the high fraction of multiple systems among them. Most or all massive stars are suspected to be born as part of multiple systems (Mason et al. 2009; Maíz Apellániz 2010; Sana & Evans 2011). Accurate knowledge of the multiplicity of massive stars is therefore key to understanding their formation and evolution. Our knowledge is especially fragmentary at the highest masses, where these objects are extremely rare. Almost all known stars with masses ≥50 M⊙ are located at distances larger than one kiloparsec (kpc) and affected by high extinction, which makes them faint and hard to resolve. Because of these difficulties, studying each individual extremely massive system matters to obtain reliable statistics of their properties.
HD 150136 in the open cluster NGC 6193 is such a system. Niemela & Gamen (2005) found that the brightest component of HD 150136 is of spectral type O3. At a distance of 1.30 ± 0.12 kpc (Herbst & Havlen 1977) it is the closest star of this kind. In a detailed spectroscopic study Mahy et al. (2012) found a third massive component in HD 150136 that was already tentatively predicted by Niemela & Gamen (2005). Mahy et al. (2012) reported that the tightly bound inner system is composed of a primary (P) of spectral type O3V((f*))–3.5V((f+)) and a secondary (S) of O5.5−6V with eccentricity e = 0, inclination i = 49° ± 5°, and an orbital period of 2.67 days. The tertiary (T) was reported to be of spectral type O6.5−7V and in orbit around the inner system with a period of 3000 to 5500 days. During the refereeing process of this letter we became aware that Sana et al. (2013) determined the first solution of the orbit between T and the inner system using independent interferometric and spectroscopic data. They resolved T with a projected angular separation of ~9 milliarcsec (mas) at a position angle of 236° N → E with a period of 8.2 years and an eccentricity (e) of 0.73. The dynamical mass of HD 150136 found by these authors agrees with the previous predictions of Mahy et al. (2012) with 63 ± 10, 40 ± 6 and 33 ± 12 M⊙ for P, S and T, respectively.
The flux ratio between the inner system and T observed from the H-band interferometric measurements supports the previous estimation of spectral types and evolutionary stages (main-sequence stars) suggested by Mahy et al. (2012). To unveil the link of the observed multiplicity and the evolutionary models of massive stars, a continuing interferometric and spectroscopic monitoring is mandatory.
Here, we report new long-baseline interferometric measurements of HD 150136 with the instrument AMBER at the ESO Very Large Telescope Interferometer (VLTI)1. Our aim was to resolve T at different NIR frequencies to (i) provide accurate astrometric measurements to constrain the orbit of the system (P+S)+T and (ii) to provide new photometric estimates of T via direct measurement of its luminosity relative to the inner system.
2. Observations and data reduction
A single snapshot observation of HD 150136 was obtained with AMBER in its low-resolution mode (LR-HK), using the VLT unit telescopes (UTs) 1, 3, and 4 on March 4, 2013 (JD 2 456 355.9). The triplet used for our observations has a maximum baseline length of 130 m and a minimum baseline length of 63 m. The synthesized beam obtained with this configuration has 3.59 × 1.43 milliarcsec (mas) with a position angle of 314.9°. The instrumental setup allowed us to obtain measurements in the J-, H-, and K-bands with a spectral resolution of R = λ/Δλ ≈ 35. A standard calibrator – science target – calibrator observing sequence was used. The chosen calibrator, HD 149835, is separated by 1.47° deg from HD 150136. It is a K0III star with a magnitude of J = 5.5, H = 5.1, and K = 4.9, similar to the corresponding magnitudes of the target (see Table 2). The airmass reported for the calibrator is 1.19, and 1.15 for the target, respectively. Figure 1 shows the u − v coverage of our observations.
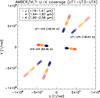 |
Fig. 1 u − v coverage of our AMBER/VLTI observations of HD 150136. The baseline length is displayed in the plot. |
For the AMBER data reduction we used the amdlib32 data reduction software, which uses the algorithms provided in Tatulli et al. (2007) and Chelli et al. (2009). To eliminate frames that were deteriorated by variable atmospheric conditions and/or technical problems (e.g., shifts in the path delay), we selected only the 20% of frames with the highest signal-to-noise ratio (S/N). The two sets of calibrator observations exhibit a similar V2 response within 5% accuracy. Hence, we interpolated a linear fit to the calibrator visibilities for the epoch of the science target to normalize our visibilities. The obtained calibrated squared visibilities (V2) at K-band and closure phases (CPs) are displayed in Fig. 2.
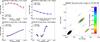 |
Fig. 2 Left: CP and V2 model fitting. Data are shown as black diamonds and the best obtained model as colored lines. Right: BSMEM reconstructed image of HD 150136. The total flux is normalized, contours represent 3, 7, 15, 30, 60, 80, and 95% of the maximum. The black ellipse at the bottom-left represents the synthesized beam of our interferometer. |
3. Analysis
We note that the apparent separation between P and S in the inner system of HD 150136 is about 0.1 mas (Mahy et al. 2012), and thus more than one order of magnitude smaller than what can be resolved with VLTI in the near-infrared (NIR). To fit the calibrated measurements we therefore chose the model of a binary, composed of two unresolved sources (inner system plus tertiary companion, T). The model fitting was made with the LITpro software to obtain the best-fit model parameters (Tallon-Bosc et al. 2008).
When fitting the CPs and V2 of all bands simultaneously, we noted significant systematic residuals at the shorter wavelengths: the V2 values were consistently too low for all baselines in J and showed some systematic errors for the shortest baseline (UT1-UT3) in H. Since the photon count of the target was unexpectedly low in J and H, we suspect some technical problems were present in the observations, but could not identify the exact cause. Hence, to circumvent the systematics observed in the V2 from the unsatisfactory calibration in J- and H-band, we chose to restrict the model fit only to the CP data of the three bands. Since CP data by definition eliminate with high reliability most of the atmospheric effects, they are, usually, much more robust to systematic errors than V2, which are strongly affected by weather conditions (e.g. strong variable seeing). Therefore, the use of CP to our model fitting provides a good estimator of the real brightness distribution of the source. The model was fitted to the combined CPs from all bands and to the CPs from each band individually. The resulting fits for the individual bands are shown in Fig. 2. Any biases are small with respect to the dynamic range of the data.
The best-fit parameters are listed in Table 1. We find an angular separation of 7.27 ± 0.05 mas of T from the inner system, a position angle on the sky of 209 ± 2° east of north, and a flux ratio of fT/finner = 0.25 ± 0.03. The 1σ uncertainties were estimated from the standard deviations of the best-fit values from the fits to the individual bands. When we extended the model fit to both the V2 amplitudes and the CPs for the three individual bands, the resulting fits agree within the 1σ uncertainties with the CP-only fits. This additionally supports our results. For illustrative purposes, we show the fit to the K-band V2 data of the reported model in Fig. 2.
Image reconstruction from the interferometric data was performed with the BSMEM package (Lawson et al. 2004). This code uses a maximum-entropy algorithm to recover the real brightness distribution of the source. For the image reconstruction we decided to include all CP and V2 of the three observed wavelengths to improve the quality of the image and reduce the sidelobes. The best reconstructed image was created after 45 iterations. It is displayed in Fig. 2 and is consistent with the parameters obtained from the model fitting.
Best-fit parameters of a binary model (inner system plus tertiary) for HD 150136 to the closure phases of all bands combined and of each band individually.
4. Results and discussion
The measured flux ratio between the tertiary and the inner system agrees well with the flux ratio that results from the V magnitudes computed for the three components by Mahy et al. (2012): ftheor,T/inner = 0.19 ± 0.08, and with the H-band astrometric measurements by Sana et al. (2013): fPIONIER,T/inner = 0.24 ± 0.02. For a more detailed analysis of the source brightness, we used the Bayesian code CHORIZOS (Maíz Apellániz 2004) to obtain the extinction for HD 150136 using as input the Strmgren + NIR photometry in Table 2. More specifically, we used the Milky Way spectral-energy distribution (SED) grid of Maíz Apellániz (2013a) and the new family of extinction laws described in Maíz Apellániz (2013b). The results of the fit are a monochromatic color excess E(4405 − 5495) = 0.431 ± 0.009 and an extinction law with R5495 = 4.12 ± 0.13. The somewhat high value of R5495 is typical of stars in H ii regions such as HD 150136 and the value of E(4405 − 5495) is within the expected range for a star of its Galactic coordinates and distance. The above values correspond to AJ = 0.560 ± 0.021, AH = 0.360 ± 0.013, and AK = 0.230 ± 0.009. However, the highest residual of the fit comes from the K-band photometry, suggesting a low excess in the observed spectrum of about 0.03 mag. We also verified that the existing Tycho-2 photometry agrees with the model SED derived from CHORIZOS.
Strömgren and NIR photometry of HD 150136.
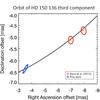 |
Fig. 3 Orbital motion of T around the inner system. The coordinate system is centered on the P + S position, the red ellipses correspond to the astrometric positions of Sana et al. (2013) and the blue one to our AMBER data. The size of the ellipse is equivalent to 1σ uncertainty and the straight blue and red lines indicate the offsets of the measured astrometric positions from the best orbital fit. The continuous black line represents the best fit to the orbital motion. |
The age of the HD 150136 system cannot be too young (~0.1 Ma) because the system has clearly emerged from the embedded phase. On the other hand, it cannot be too old (~2 Ma or older) because in that case the more massive component would have evolved to a later spectral type than O3 V. Therefore, the age must be close to 1 Ma. Using the corresponding Geneva isochrone without rotation (Lejeune & Schaerer 2001) and assuming Teff of 44 500 K, 39 000 K, and 37 000 K for P, S, and T, respectively, we derive a flux ratio T/(P+S) in the K band of 0.22, which is within one sigma of our value. Such a triple system should have a combined absolute magnitude in the K band of − 5.04 (as derived from the assumed isochrone and temperatures). On the other hand, after correcting for a distance of 1.3 kpc and the extinction derived above, a measured K magnitude of 4.991 results in an absolute magnitude MK = −5.81, significantly brighter than expected. If, however, we assume an age of 1.8 Ma, the total expected magnitude of the system would increase by more than a magnitude. Hence, one possibility is that the system is several hundred thousand years older than 1 Ma.
From the flux ratio between the inner system and T obtained at each filter as well as the described photometric analysis, we obtained the following absolute magnitudes for T: MT,J = −4.34 ± 0.23, MT,H = −4.09 ± 0.21 and MT,K = −3.93 ± 0.21. These values agree (within 1σ confidence) with the colors of an O6.5−O7 main-sequence star according to the calibration of O-type stars developed by Martins & Plez (2006). Consistently, the J-, H- and K-absolute magnitudes of the inner system (Minner,J = −5.71 ± 0.23, Minner,H = −5.60 ± 0.21 and Minner,K = −5.59 ± 0.21) also (within 1σ accuracy) agree with a combined pair of O3 + O5.5 stars (Mtheor,J = −5.63, Mtheor,H = −5.52 and Mtheor,K = −5.42; Martins & Plez 2006), as expected. Such a photometric analysis, only feasible with our multi-wavelength interferometric observations, clearly provides consistent information on the nature of HD 150136.
Additionally, we found an angular separation of T from the inner system of 7.22 ± 0.22 mas and a position angle of 209 ± 2° N→E. These measurements are consistent with the results obtained by Sana et al. (2013). Nevertheless, to improve the knowledge of T orbital motion, we performed a model fitting of the period and epoch (keeping the rest of the orbital parameters fixed) of T toward the inner system. For this purpose we combined our new interferometric measurement with the radial velocities and the two astrometric epochs of Sana et al. (2013). Our best fit retrieves a change in the orbital period from 3008 to 2770 days and a modification in the epoch (periastron passage) from 2 451 241 to 2 451 614. A preliminary analysis of our spectroscopic data from monitoring HD 150136 within the OWN Survey project (Barbá et al. 2010) from April 2005 to July 2012, and the recent published spectral analysis of Sana et al. (2013) indicate that T may indeed be approaching the periastron of its orbit within the next two years. Interferometric measurements at this position will help us to unambiguously derive the semi-minor axis of the orbit and to constrain the other orbital parameters with high precision. Figure 3 displays the best fit of our interferometric data in addition to the previous measurements.
HD 150136 is one more example of the increasing number of O stars that belong to multiple systems with gravitationally bound components at different spatial scales (e.g. Herschel 36; Arias et al. 2010). The fact that massive stars are born in multiple systems have strong implications on their star formation scenarios. Thus, the orbital motion of component T around the HD 150136 inner system deserves a complete study to test the coplanarity of the orbits in this massive multiple, which can provide us with important clues about its formation. The currently favored theoretical models for the formation of high-mass stars are (i) the collapse of a massive monolithic protostellar core (Krumholz et al. 2009) and (ii) competitive accretion in clusters (Bonnell et al. 2006). On average, the components of a massive multiple that forms through collapse of a monolithic cloud are expected to have coplanar orbits, while the formation of massive stars from clouds with a hierarchical substructure (or posterior formation of multiples from dynamical encounters) will favor the creation of systems with more randomly distributed orbits. High-resolution spectroscopy will have to be combined with astrometry from the high angular resolution (~2 mas) of AMBER NIR interferometry to acquire the necessary data for such future work.
Based on observations collected at the European Organization for Astronomical Research in the Southern Hemisphere, Chile, within observing programme 090.D-0689(A).
Available at: http://www.jmmc.fr/amberdrs
Available at: http://www.eso.org/~chummel/oyster/oyster.html
Acknowledgments
We thank the referee for his/her useful comments. J.S.B., R.S. and A.A. acknowledge support by grants AYA2009-13036, AYA2010-17631 and AYA2012-38491-CO2-02 of the Spanish Ministry of Economy and Competitiveness, and by grant P08-TIC-4075 of the Junta de Andalucía. R.S. acknowledges support by the Ramón y Cajal programme of the Spanish Ministry of Economy and Competitiveness. J.M.A. acknowledges support by grants AYA2010-17631 and AYA2010-15081 of the Spanish Ministry of Economy and Competitiveness. R.H.B. acknowledges financial support from FONDECYT Regular Project No. 1120668. J.S.B. acknowledges support by the ESO studentship program, to the JAE-PreDoc program of the Spanish Consejo Superior de Investigaciones Científicas (CSIC) and to CAH for the OYSTER3 software.
References
- Arias, J. I., Barbá, R. H., Gamen, R. C., et al. 2010, ApJ, 710, L30 [NASA ADS] [CrossRef] [Google Scholar]
- Barbá, R. H., Gamen, R., Arias, J. I., et al. 2010, in Rev. Mex. Astron. Astrofis. Conf. Ser., 38, 30 [Google Scholar]
- Bonnell, I. A., & Bate, M. R. 2006, MNRAS, 370, 488 [NASA ADS] [CrossRef] [Google Scholar]
- Castelli, F., & Kurucz, R. L. 2003, in Modelling of Stellar Atmospheres, eds. N. Piskunov, W. W. Weiss, & D. F. Gray, IAU Symp., 210, 20 [Google Scholar]
- Chelli, A., Utrera, O. H., & Duvert, G. 2009, A&A, 502, 705 [NASA ADS] [CrossRef] [EDP Sciences] [Google Scholar]
- Clarke, A. J., Oudmaijer, R. D., & Lumsden, S. L. 2005, MNRAS, 363, 1111 [NASA ADS] [CrossRef] [Google Scholar]
- Grønbech, B., & Olsen, E. H. 1976, A&AS, 25, 213 [NASA ADS] [Google Scholar]
- Herbst, W., & Havlen, R. J. 1977, A&AS, 30, 279 [NASA ADS] [Google Scholar]
- Kraus, S., Weigelt, G., Balega, Y., et al. 2009, A&A, 497, 195 [NASA ADS] [CrossRef] [EDP Sciences] [Google Scholar]
- Krumholz, M. R., Klein, R. I., McKee, C. F., Offner, S. S. R., & Cunningham, A. J. 2009, Science, 323, 754 [NASA ADS] [CrossRef] [PubMed] [Google Scholar]
- Lawson, P. R., Cotton, W. D., Hummel, C. A., et al. 2004, in SPIE Conf. Ser. 5491, ed. W. A. Traub, 886 [Google Scholar]
- Lejeune, T., & Schaerer, D. 2001, VizieR Online Data Catalog, 6102 [Google Scholar]
- Mahy, L., Gosset, E., Sana, H., et al. 2012, A&A, 540, A97 [NASA ADS] [CrossRef] [EDP Sciences] [Google Scholar]
- Maíz Apellániz, J. 2004, PASP, 116, 859 [NASA ADS] [CrossRef] [Google Scholar]
- Maíz Apellániz, J. 2010, A&A, 518, A1 [NASA ADS] [CrossRef] [EDP Sciences] [Google Scholar]
- Maíz Apellániz, J. 2013a, Highlights of Spanish Astrophysics VII, 657 [Google Scholar]
- Maíz Apellániz, J. 2013b, Highlights of Spanish Astrophysics VII, 583 [Google Scholar]
- Martins, F., & Plez, B. 2006, A&A, 457, 637 [NASA ADS] [CrossRef] [EDP Sciences] [Google Scholar]
- Mason, B. D., Hartkopf, W. I., Gies, D. R., Henry, T. J., & Helsel, J. W. 2009, AJ, 137, 3358 [NASA ADS] [CrossRef] [EDP Sciences] [Google Scholar]
- Niemela, V. S., & Gamen, R. C. 2005, MNRAS, 356, 974 [NASA ADS] [CrossRef] [Google Scholar]
- Sana, H., & Evans, C. J. 2011, in IAU Symp. 272, eds. C. Neiner, G. Wade, G. Meynet, & G. Peters, 474 [Google Scholar]
- Sana, H., Le Bouquin, J.-B., Mahy, L., et al. 2013, A&A, 553, A131 [NASA ADS] [CrossRef] [EDP Sciences] [Google Scholar]
- Skrutskie, M. F., Cutri, R. M., Stiening, R., et al. 2006, AJ, 131, 1163 [NASA ADS] [CrossRef] [Google Scholar]
- Tallon-Bosc, I., Tallon, M., Thiébaut, E., et al. 2008, in SPIE Conf. Ser., 7013 [Google Scholar]
- Tatulli, E., Millour, F., Chelli, A., et al. 2007, A&A, 464, 29 [NASA ADS] [CrossRef] [EDP Sciences] [Google Scholar]
All Tables
Best-fit parameters of a binary model (inner system plus tertiary) for HD 150136 to the closure phases of all bands combined and of each band individually.
All Figures
|
Fig. 1 u − v coverage of our AMBER/VLTI observations of HD 150136. The baseline length is displayed in the plot. |
| In the text | |
|
Fig. 2 Left: CP and V2 model fitting. Data are shown as black diamonds and the best obtained model as colored lines. Right: BSMEM reconstructed image of HD 150136. The total flux is normalized, contours represent 3, 7, 15, 30, 60, 80, and 95% of the maximum. The black ellipse at the bottom-left represents the synthesized beam of our interferometer. |
| In the text | |
|
Fig. 3 Orbital motion of T around the inner system. The coordinate system is centered on the P + S position, the red ellipses correspond to the astrometric positions of Sana et al. (2013) and the blue one to our AMBER data. The size of the ellipse is equivalent to 1σ uncertainty and the straight blue and red lines indicate the offsets of the measured astrometric positions from the best orbital fit. The continuous black line represents the best fit to the orbital motion. |
| In the text | |
Current usage metrics show cumulative count of Article Views (full-text article views including HTML views, PDF and ePub downloads, according to the available data) and Abstracts Views on Vision4Press platform.
Data correspond to usage on the plateform after 2015. The current usage metrics is available 48-96 hours after online publication and is updated daily on week days.
Initial download of the metrics may take a while.