| Issue |
A&A
Volume 554, June 2013
|
|
|---|---|---|
| Article Number | A19 | |
| Number of page(s) | 7 | |
| Section | Stellar structure and evolution | |
| DOI | https://doi.org/10.1051/0004-6361/201321311 | |
| Published online | 30 May 2013 | |
Photometric properties of stellar populations in Galactic globular clusters: the role of the Mg-Al anticorrelation
1 INAF – Osservatorio Astronomico di Teramo, via Mentore Maggini, 64100 Teramo, Italy
e-mail: cassisi@oa-teramo.inaf.it; pietrinferni@oa-teramo.inaf.it
2 Dipartimento di Fisica e Astronomia, Universitá degli Studi di Bologna, Viale Berti Pichat, 6/2, 40127 Bologna, Italy
e-mail: alessio.mucciarelli2@unibo.it
3 Astrophysics Research Institute, Liverpool John Moores University, Twelve Quays House, Birkenhead, CH41 1LD, UK
e-mail: ms@astro.livjm.ac.uk
4 Department of Physics, Wichita State University Wichita, KS 67260, USA
e-mail: jason.ferguson@wichita.edu
Received: 18 February 2012
Accepted: 20 March 2013
We have computed low-mass stellar models and synthetic spectra for an initial chemical composition that includes the full C-N, O-Na, and Mg-Al abundance anticorrelations observed in second-generation stars belonging to a number of massive Galactic globular clusters. This investigation extends a previous study that addressed the effect of only the C-N and O-Na anticorrelations seen in all globulars observed to date. We find that the impact of Mg-Al abundance variations at fixed [Fe/H] and helium abundance is negligible on stellar models and isochrones (from the main sequence to the tip of the red giant branch) and bolometric corrections, when compared to the effect of C-N and O-Na variations. We identify a spectral feature at 490–520 nm, for low-mass main sequence stars, caused by MgH molecular bands. This feature has a vanishingly small effect on bolometric corrections for Johnson and Strömgren filters that cover that spectral range. However, specific narrow-band filters able to target this wavelength region can be powerful tools for investigating the Mg-poor unevolved stars and highlight possible splittings of the main sequence due to variations of Mg abundances.
Key words: stars: abundances / Hertzsprung-Russell and C-M diagrams / stars: evolution / globular clusters: general
© ESO, 2013
1. Introduction
Modern spectroscopic surveys of several Galactic globular clusters (GCs) have confirmed earlier results about the existence of well-defined chemical patterns in the atmospheres of stars within individual GCs, overimposed to the standard α-enhanced metal mixture typical of field halo stars, as reviewed in, e.g. 19. Specifically, there is undisputed evidence that all GCs studied so far display anticorrelations between C and N, plus O and Na – the so-called C-N-O-Na anticorrelations – amongst their stars, at fixed [Fe/H] (but a handful of exceptions that show also a spread of [Fe/H]). These anticorrelations go in the sense of increasing N whilst decreasing C, and increasing Na while decreasing O, with respect to the baseline α-enhanced metal composition. Many clusters – but not all – also show an anticorrelation between Mg and Al – the Mg-Al anticorrelation – whereby Mg is also depleted and Al is enhanced compared to the baseline α-enhanced mixture, as discussed in 18 and 7 for several GCs. The presence of these abundance patterns is a signature of matter processed via high-temperature proton capture reactions, like the NeNa and MgAl cycle. Given that H burning synthesizes He, one expects that these abundance patterns are associated with He enhancement, as extensively discussed in, e.g. 11.
Given that observations detect these abundance anticorrelations from the fainter portion of the main sequence (MS) – as recently shown by 30 – all the way to the tip of the red giant branch (RGB), without signatures of dilution due to the varying size of the convective envelope, it is clear that their origin must be primordial1, thus challenging the canonical idea that GCs host coeval stars, all formed with the same initial chemical composition.
Additional, clear-cut evidence for multiple stellar populations in individual GCs has been provided by high-precision HST photometry, that has revealed in the colour magnitude diagrams (CMDs) of several GCs the existence of multiple MSs – as in the cases of ω Cen (see, e.g. King et al. 2012, and references therein), and NGC 2808 (Piotto et al. 2007) – and/or multiple sub-giant branch (SGB) – as for NGC 1851 (Milone et al. 2008), 47 Tuc (Milone et al. 2012), NGC 362, NGC 5286, NGC 6656, NGC 6715, NGC 7089 (Piotto et al. 2012), NGC 6388 and NGC 6441 (Bellini et al. 2013) –, and/or multiple RGB sequences – as in the cases of NGC 6121 (Marino et al. 2008), and NGC 6656 (Marino et al. 2011). The observed number of sequences and their photometric properties do change significantly from cluster to cluster, and strongly depend on the adopted photometric system. Passbands including strong molecular bands of CN (bandheads at 388.3 and 421.6 nm), NH (around 345.0 nm), or CH (around 430.0 nm) – see, e.g. 20, 21, 8, 29, and 36 – are particularly suited to photometrically disclose multiple populations.
The commonly accepted scenario envisages that in a GC an additional generation of stars (second generation – SG) forms from the ejecta of intermediate-mass and/or massive stars belonging to the first stellar population (first generation – FG) originated during the early phase of the cluster evolution. The chemical composition of these ejecta shows signatures of high-temperature proton captures, and after some dilution with pristine (unpolluted) matter – that seems necessary to explain the observations, as discussed in 15 – SG stars would be then formed from gas characterized by the observed light-element anticorrelations and some level of He enhancement.
The existence of a strong correlation between spectroscopic signatures of the distinct subpopulations and their distribution along the observed CMDs, has suggested that the chemical patterns of SG stars do affect both the evolutionary properties of these stars and their spectral energy distribution. To this purpose, several theoretical investigations – see, e.g. 40; 13; 45; 35 – have studied the effect of SG chemical patterns on the structure and evolution of low-mass, low-metallicity stars. Recently 42 have also performed the first detailed investigation of the effect of SG chemical compositions on spectra, bolometric corrections, and colours, for widely used blue to near-infrared photometric filters. These bolometric corrections and colour-transformations, coupled to theoretical isochrones with the appropriate chemical composition, represent the first complete and self-consistent set of theoretical predictions for the effect of FG and SG stars on the observed cluster CMDs.
The main outcomes of these theoretical analyses can be summarized as follows. Colour and magnitude changes are largest in blue photometric filters, bluer than the standard B filter, independently of using broad or intermediate bandpasses such as the Strömgren filters, so providing a sound interpretation of the observational findings previously mentioned. In particular, CMDs involving uvy and UB filters are best suited to detect photometrically the presence of multiple stellar generations in individual clusters because these filters are particularly sensitive to the N abundance (via its direct effect on the strength of the CN and NH molecular bands), with the largest variations affecting the RGB and lower MS. The optical bands BVI are expected to display multiple sequences only if the different populations are characterized by variations of the C+N+O sum and/or He abundance that lead to changes in the bolometric luminosity and effective temperature of stellar models, but leave the flux distribution above 400 nm practically unaffected. These results have been also confirmed and extended to the ultraviolet and infrared WFC3 photometric system by 29 and 30, respectively.
As already mentioned, the extensive and accurate spectroscopical survey performed by 3 and 7 has shown that the Mg-Al anticorrelation is present only in a subsample of clusters; in particular, extreme Mg depletions and Al enhancements have been detected only in very massive clusters like NGC 2808, NGC 6388, and NGC 6441, and/or metal-poor ones, like NGC 6752. The most extreme values have been found in NGC 2808. With its triple MS – explained by three distinct initial He abundances – and its very extended Na-O anticorrelation, this cluster is one of the most peculiar GCs in terms of the hosted populations. Finally, we mention the discovery by 32 of a large sample of very Mg-poor stars in NGC 2419, not coupled to a large Al-enhancement, which could be a unique case of a stellar population directly formed from the ejecta of asymptotic and super asymptotic giant branch stars, as discussed by 46.
To date, the effect of the Mg-Al anticorrelation on the CMDs of Galactic GCs has been, however, largely unexplored The impact of selectively enhancing the abundance of Mg with respect to the other heavy elements in the stellar spectra and/or models has been investigated theoretically to different degrees by 12; 16; 24, and 44. To the best of our knowledge, there has been no attempt to assess the effect on both stellar models and spectra of a change in the relative abundances of both Mg and Al, consistent with the spectroscopic measurements.
The aim of this work is therefore to study the possible impact of a Mg-Al anticorrelation added to C-N-O-Na anticorrelations, on the CMDs of GCs, by computing stellar models and bolometric corrections that account self-consistently for realistic FG and SG chemical patterns. The results of this investigation will help studies aimed at tracing the presence of the distinct populations in a cluster, based on pure photometric analyses along all the relevant evolutionary stages – see, e.g. 31 – given that high-resolution spectroscopic analyses are so far limited to a relatively small number of objects, mostly bright RGB stars.
The structure of the paper is as follows: the next section presents the stellar evolution models, whilst Sect. 3 describes the model atmosphere and synthetic spectrum calculations, followed by our conclusions.
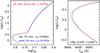 |
Fig. 1 Left panel: evolutionary tracks for 0.8 M⊙ models and Z = 0.001, Y = 0.246 FG, and SG chemical compositions. An additional numerical experiment with modified opacity tables is also shown (see text for details). MS lifetimes are listed. Right panel: as left panel but with an enlargement of the MS-TO-SGB region. |
2. The evolutionary framework
We consider here a reference BaSTI2α-enhanced isochrone from 34 with an age of 12 Gyr, initial He abundance and metallicity equal to Y = 0.246 and Z = 0.001, respectively. For the α-enhanced heavy element mixture of the BaSTI database, these choices correspond to a [Fe/H] = −1.62. This isochrone is representative of FG stars present in a typical Galactic GC.
Mass and number fractions (normalized to unity) for the FG and the CNONa2MgAl metal mixtures.
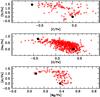 |
Fig. 2 The three panels display a comparison of the abundances of our FG and CNONa2MgAl compositions (large filled circles) with selected observational data (from top to bottom): the [C/Fe]-[N/Fe] diagram (data for 47 Tuc and NGC 6752 from Briley et al. 2004; Carretta et al. 2005), [O/Fe]-[Na/Fe] diagram (data for several clusters from Carretta et al. 2009a), [Mg/Fe]–[Al/Fe] diagram (data for NGC 6752 from Carretta et al. 2012). |
Since in 35 and Sbordone (2011, see their Table 2) we already explored the impact on both isochrones and spectra of He-enhancement and C-N-O-Na anticorrelations both with and without keeping constant the sum of CNO elements, we now focus our attention on the presence of an additional Mg-Al anticorrelation keeping the C + N + O total abundance constant. Specifically, we have selected one of the three metal mixtures used in 42, the so-called CNONa2 mixture characterized by a depletion of C and O by 0.6 dex and 0.8 dex by mass, respectively, and by enhancements of N and Na by 1.44 dex and 0.8 dex, compared to the FG metal abundances. To these changes, we have also added an enhancement of Al by 1 dex, and a depletion of Mg by 0.3 dex, with respect to the FG mixture. The Mg-Al variations are similar to the most extreme cases, observed in clusters like NGC 6752 and NGC 2808 (see Carretta et al. 2009b, 2012). Our adopted CNONaMgAl abundance pattern corresponds to [(C+N)/Fe] = 0.73 (compared to [(C+N)/Fe] = 0.0 for the FG α-enhanced mixture), [(C+N+O)/Fe] = 0.37 (within 0.5% of the FG value), and [(Mg+Al)/Fe] = 0.28 (compared to [(Mg+Al)/Fe] = 0.38 for the FG mixture). We denote this mixture as CNONa2MgAl, which corresponds to extreme values of the light element anticorrelations observed in Galactic GCs. In this way we maximize the impact of the SG composition on both models and spectra. The chemical abundances for both the SG CNONa2MgAl and FG metal mixtures are listed in Table 1. Figure 2 compares the values of [C/Fe], [N/Fe], [O/Fe], [Na/Fe], [Mg/Fe], and [Al/Fe] for our FG mixture and the CNONa2MgAl composition with observations of a few clusters.
We then computed low-mass stellar models with [Fe/H] = − 1.62 and Y = 0.246, for both metal compositions (which correspond to the same total metallicity Z = 0.001).
Opacities for the stellar interiors have been obtained from the Livermore Laboratory OPAL opacity website3, while the low-temperature opacity tables have been computed for this specific project. The other physics inputs are as described by 34 for the FG models.
Figure 1 displays the theoretical Hertzsprung-Russell (H-R) diagram of 0.8 M⊙ models calculated with the CNONa2MgAl and FG mixtures, respectively, from the MS to the tip of the RGB. The two tracks overlap almost perfectly along the MS, and the turn off (TO) luminosities differ by only Δlog (L/L⊙) ≈ 0.017, the FG track being slightly brighter. At the TO Teff differences are ~30 K, whilst at the base of the RGB the difference in Teff is almost zero, increasing to just ~20 K at the tip of the RGB, FG models being the hotter ones. Lifetimes are also almost identical, in fact the CNONa2MgAl model is only ~1% older at the TO. Core masses at the He-flash, as well as RGB bump luminosity and envelope He mass fraction after the first dredge up are also the same. The very small differences observed around the TO and the SGB are, as previously mentioned, a consequence of the CNONa2MgAl mixture is slightly more CNO-rich (by ~0.5%) than the mixture adopted for the FG.
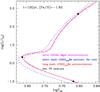 |
Fig. 3 Isochrones for an age of 12 Gyr and [Fe/H] = −1.61, under various assumptions about the metal mixture and the initial He abundance. The CNONa-MgAl label denotes the mixture with the C-N, Na-O and Mg-Al anticorrelations, and Y = 0.246; (CNO)enhNa denotes a mixture with C-N, Na-O anticorrelation, and the CNO sum enhanced by a factor of two with respect to the FG mixture – as in 42 – and Y = 0.246; (CNO)enhNa,He − rich denotes the same mixture as the (CNO)enhNa case, but with Y = 0.40. Filled circles mark selected points along the isochrones for which we show in the following the corresponding synthetic spectra. |
To highlight the effect on the evolutionary tracks of high- and low-temperature opacities with the Mg-Al anticorrelation, we have calculated additional evolutionary models, also displayed in Fig. 1. For this calculation we have included the CNONa2MgAl metal mixture both in the nuclear network (where the effect is zero, because neither Mg nor Al are involved in H-burning reactions during the MS for low-mass stars) and in the high-temperature opacities (i.e. log T > 4.2), and the FG mixture for the low-temperature opacities. The right panel of Fig. 1 shows clearly that around the TO the opacities of the interiors determine the location of the track (this new track overlaps at the TO with the complete calculation for the CNONa2MgAl mixture), whilst the low-temperature opacities fix the Teff of the RGB (the track overlaps with the FG track along the RGB) in agreement with results by 39 and 10.
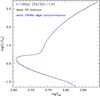 |
Fig. 4 Isochrones for an age of 12 Gyr and [Fe/H] = −1.01, Y = 0.248, computed for both FG (dashed line) and “CNONa2MgAl” (solid line) chemical compositions. |
With the help of additional tracks for different masses we have calculated a typical GC isochrone for 12 Gyr, [Fe/H] = −1.62, Y = 0.246, from the MS (minimum mass equal to 0.5 M⊙) to the tip of the RGB, and the “CNONa2MgAl” mixture. This is compared in Fig. 3 with additional isochrones for the same age and the same [Fe/H] = −1.61 that we calculated in 42. First of all, the CNONa2MgAl isochrone overlaps with the FG isochrone and the isochrone for the CNONa2 mixture (they are indistinguishable from one another). The small differences between the 0.8 M⊙ tracks for FG and CNONa2MgAl mixtures are erased because of the slightly different evolutionary timescales that produce a slightly different mass distribution along the corresponding isochrones. The perfect agreement between FG and CNONa2MgAl isochrones is confirmed also at higher metallicity, e.g. [Fe/H] = −1.01 (Y = 0.248), as displayed by Fig. 4. For the sake of comparison we also display in Fig. 3 [Fe/H] = −1.61 isochrones with extreme values of the C-N-O-Na anticorrelations and the CNO sum enhanced by a factor of two – the mixture denoted as CNONa1 in 42 – and the same CNO-enhanced mixture with an enhanced He-abundance (Y = 0.40).
As a consequence of these evolutionary computations, we can extend the analysis of the impact of light element anticorrelations on the morphology of isochrones in the H-R diagram performed by 35 and 42. As long as the sum of the CNO elements and the initial He abundance is unchanged, the presence of C-N, O-Na, and Mg-Al anticorrelations does not affect the H-R diagram of theoretical isochrones of fixed age and [Fe/H]. An increase of He (at fixed metal mixture) shifts the whole isochrone towards hotter Teff, and produces a slightly fainter TO, whereas an increase of the CNO sum makes the TO and SGB fainter, leaving the rest of the isochrone basically unchanged.
Selected points along the “CNONa2MgAl” isochrone, chosen for the model atmosphere computations.
3. Synthetic spectra
As a next step, we have investigated the effect of the Mg-Al anticorrelation on the spectral energy distribution of low-mass stars. Given that the impact of a mixture with extreme values of the C-N and O-Na anticorrelations has been already investigated by 42, here we study whether the effect of an additional (extreme) Mg-Al anticorrelation is appreciable compared to a mixture with only C-N and O-Na extreme anticorrelations.
To this purpose we have selected key-points (see Table 2) along the 12 Gyr, [Fe/H] = −1.62 FG isochrone of Fig. 3, that match those chosen by 42. For each of these (Teff, log (g)) points we have computed model atmospheres plus the corresponding synthetic spectra for two assumptions about the heavy element distributions, and calculated bolometric corrections for both the Johnson-Cousins UBVI and the Strömgren uvby photometric systems.
Model atmospheres have been calculated as in 42, by employing the ATLAS 12 code described by 14 and 41, in its last version which is available at the website of Castelli4. At variance with the ATLAS 9 code – widely employed because of its computational speed – that uses pre-tabulated line opacities in the form of opacity distribution functions (ODFs), ATLAS 12 employs the opacity sampling method for the line opacity computation. This approach (even if computationally more expensive) enables us to easily calculate models with arbitrary chemical compositions, whilst ATLAS 9 is tied to the chemical mixture adopted in the ODFs. All ATLAS 12 models assume plane-parallel geometry and LTE for all chemical species.
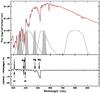 |
Fig. 5 Top panel: flux distribution for the MS model with Teff = 4621 K and log (g) = 4.77 calculated with the CNONa2 (solid line) and the CNONa2MgAl (dotted line) metal compositions. The transmission curves for the Johnson-Cousins UBVI (thin black lines) and the Strömgren uvby filters (grey-shaded regions) are also shown. Bottom panel: relative flux difference between the two spectral energy distributions, as a function of the wavelength. |
For each key point, we calculated two model atmospheres, adopting different chemical compositions: a) the SG chemical mixture with only C-N and O-Na anticorrelations, labelled CNONa2 by 42; and b) the SG CNONa2MgAl metal mixture that includes also the Mg-Al anticorrelation.
We note that all the model atmospheres, consistently with the evolutionary stellar models, have been computed by adopting [Fe/H] = − 1.62 dex, Y = 0.246. We also adopted a microturbulent velocity equal to 2 km s-1, as for the main set of calculations by 42.
Synthetic spectra have been calculated with the code SYNTHE 41 in the wavelength range from 200 to 1000 nm. We have included all atomic and molecular transitions available in the last version of the Kurucz/Castelli database5, excluding only TiO lines, because in the investigated cases there are no prominent TiO bands (and the inclusion of these transitions increases the computational time significantly). Following the procedure already adopted in 42, the spectra have been calculated at high resolution and then convolved with a Gaussian profile with FWHM = 1700 km s-1 (corresponding to a spectral resolution λ/Δλ ~ 175). Figures 5– 7 compare synthetic spectra for the two compositions, and the points displayed as filled circles along the FG isochrone in Fig. 3.
The largest differences between the displayed spectra with the CNONa2 and CNONa2MgAl mixture are found for the MS star. The prominent feature detectable between ~495 and ~521 nm corresponds to the (0, 0) vibrational band of the MgH A2Π-X2Σ system plus the prominent lines of the Mg b triplet. A weaker Mg feature is visible at ~475 nm and corresponds to the (1, 0) band of MgH. At bluer wavelengths, the absorption due to the Mg triplet at ~383.8 nm is also visible. Concerning Al, the main variations between the two synthetic spectra are close to the H and K Ca lines, due to the Al resonance lines at 394.4 and 396.1 nm, and around 309 nm (Al lines at 308.2 and 309.2 nm).
The same features can also be recognized in the synthetic spectra of the RGB star. In this case, we clearly observe the same Al lines, while the Mg features are less prominent, because the MgH bands weaken due to the decrease of the surface gravity (the variation at ~520 nm is basically caused by the Mg b triplet).
Concerning the comparison of the synthetic spectra for the TOstar, the two spectra are basically indistinguishable: the main variations do not exceed ~ ±1.5% of the flux. In this case too, these differences involve the Mg and Al transitions already mentioned for the two (Teff, log (g)) pairs discussed above.
For each spectrum, we have then calculated bolometric corrections (BCs) following the methods by 17, and the differences ΔBC at each of the points listed in Table 2, between the CNONa2MgAl and CNONa2 spectra, for the UBVI, and uvby photometric filters6. These differences for each selected point have been then added to the difference of bolometric corrections between the FG α-enhanced composition and the CNONa2 metal distribution, as derived by 42 with the same codes employed in our analysis. The resulting set of ΔBC values includes the effect of the full C-N-O-Na-Mg-Al anticorrelations, and is compared to the case of only C-N-O-Na anticorrelations in Figs. 8 and 9.
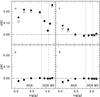 |
Fig. 8 Difference ΔBC between the uvby bolometric corrections for a standard α-enhanced FG mixture and, respectively, the CNONa2 SG mixture (open circles) and the CNONa2MgAl SG mixture for the selected points of Table 2 (see text for details). |
As can be easily gathered by comparing the filled and open circles in these two figures, and as expected from the previous analysis of individual spectra, the effect of the Mg-Al anticorrelation is extremely small, almost always below ~0.015 mag. Only the two lowest gravity points along the upper RGB display differences up to 0.03–0.04 mag in the U, u, and v filters. When log (g) = 1.20, the differences in U are a factor ~3 smaller than the corresponding difference between FG and CNONa2 determined by 42. For the u filter, differences are a factor ~10 smaller. At log (g) = 0.5 the differences in U, and u are a factor ~3–4 smaller; only for the v filter the BC difference is more comparable to the relatively small difference between FG and CNONa2 BCs.
As a conclusion, the role played by the Mg-Al anticorrelation in both the theoretical isochrones and bolometric corrections appears generally negligible compared to the effect of the C-N-O-Na anticorrelation, at least for the photometric systems investigated here.
4. Conclusions
We have explored self-consistently the impact of a metal mixture that reflects extreme values of the C-N, O-Na, and Mg-Al anticorrelations observed in Galactic GCs, on both theoretical H-R diagrams and CMDs of old metal-poor populations, from the MS to the tip of the RGB. The main conclusion of our investigation is that the effect of the Mg-Al anticorrelation on the evolutionary properties of low-mass stars, and hence theoretical isochrones for old stellar populations, is negligible. This confirms the theoretical inferences discussed by 40. As far as it concerns the BC scale, the effect is vanishing when compared to the rôle played by the C-N-O-Na anticorrelations, but in the case of BCs for the v Strömgren filter, and only for stars near the tip of the RGB.
Based on the isochrones displayed in Fig. 3, the results about the BC scales by 42, and Figs. 8 and 9, one can confirm the following general conclusions about the photometric properties of GC multiple populations, from the MS to the tip of the RGB:
-
Visible to near-infrared CMDs (e.g. BVI or Strömgren y) are generally unaffected by the presence of SG stars, unless this stellar component has a different initial He content. In this case multiple sequences appear along the MS. This explains very nicely the multiple MS of NGC 2808 in optical CMDs discussed by 37. A variation of the CNO sum also affects optical CMDs by altering the location of TO and SGB. This is a possible explanation for the double SGB of NGC 1851 in optical filters discovered by 28 (see Cassisi et al. 2008), as well as for the double SGB observed in NGC 6656 (Marino et al. 2012). Both He and CNO affect optical CMDs because they hugely affect the stellar evolutionary properties, and hence modify the isochrone location in the H-R diagram.
-
At shorter wavelengths, C-N-O-Na-Mg-Al anticorrelations affect the BC scale so that even at constant CNO and He abundances SG and FG stars will be distributed – continuously, in the case of a continuous distribution of the abundance anticorrelations – amongst several separate sequences. The quantitative effect will depend on the filter combination employed and the exact over- and underabundances with respect to the baseline FG composition. Variations of He and CNO add an additional level of separation in the CMDs, as a consequence of their effect on the underlying isochrones (both He and CNO sum) and BCs (mainly because of the CNONa anticorrelations).
The general conclusion is that therefore anticorrelated Mg and Al variations do not leave any signature in CMDs of GCs, at least for the widely used filters discussed in this paper. However, we wish to note that the most relevant difference between synthetic spectra of CNONa2 and CNONa2MgAl is observed in the MS spectrum shown in Fig. 5 and is related to the MgH molecular bands. The standard filters investigated here are not able to isolate the effect of this molecular band at 490–520 nm, hence this feature has a vanishingly small effect on the corresponding BCs. This feature can, however, be potentially useful for detecting stars characterized by Mg depletion along the MS. In general, the Mg depletion observed in GC stars is smaller than the O depletion, and stars with sub-solar [Mg/Fe] ratios are less common. Specific narrow-band filters centred on this spectral region can be powerful tools for investigating the Mg-poor unevolved stars
and for highlighting possible new splittings of the MS due to relatively small variations of Mg abundance.
It is important to mention that “overimposed” to these primordial abundance anticorrelations, there is also an evolutionary effect during the RGB phase, both in globular clusters and in the Galactic field, whereby the C abundance is increasingly depleted and N progressively enhanced after the RGB bump. This is usually interpreted as the result of additional mixing processes, as discussed in, e.g. 22 for the case of giant stars in the GC M 13.
Acknowledgments
We warmly thank our referee for her/his constructive comments. S.C. is grateful for financial support from PRIN-INAF 2011 “Multiple Populations in Globular Clusters: their role in the Galaxy assembly” (PI: E. Carretta), and from PRIN MIUR 2010-2011, project “The Chemical and Dynamical Evolution of the Milky Way and Local Group Galaxies”, prot. 2010LY5N2T (PI: F. Matteucci).
References
- Bellini, A., Piotto, G., Milone, A. P., et al. 2013, ApJ, 765, 32 [NASA ADS] [CrossRef] [Google Scholar]
- Bessell, M. S. 1990, PASP, 102, 1181 [NASA ADS] [CrossRef] [Google Scholar]
- Bragaglia, A., Carretta, E., Gratton, R. G., et al. 2010, ApJ, 720, 41 [Google Scholar]
- Briley, M. M., Harbeck, D., Smith, G. H., & Grebel, E. K. 2004, AJ, 127, 1588 [NASA ADS] [CrossRef] [Google Scholar]
- Carretta, E., Gratton, R. G., Lucatello, S., Bragaglia, A., & Bonifacio, P. 2005, A&A, 433, 597 [NASA ADS] [CrossRef] [EDP Sciences] [Google Scholar]
- Carretta, E., Bragaglia, A., Gratton, R. G., et al. 2009a, A&A, 505, 117 [NASA ADS] [CrossRef] [EDP Sciences] [Google Scholar]
- Carretta, E., Bragaglia, A., Gratton, R. G., & Lucatello, S. 2009b, A&A, 505, 139 [NASA ADS] [CrossRef] [EDP Sciences] [Google Scholar]
- Carretta, E., Bragaglia, A., Gratton, R., D’Orazi, V., & Lucatello, A. 2011, A&A, 535, A121 [NASA ADS] [CrossRef] [EDP Sciences] [Google Scholar]
- Carretta, E., Bragaglia, A., Gratton, R. G., Lucatello, S., & D’Orazi, V. 2012, ApJ, 750, L14 [NASA ADS] [CrossRef] [Google Scholar]
- Cassisi, S. 2005, Proc. meeting Resolved Stellar Populations, Cancun, Mexico [arXiv:astro-ph/0506161] [Google Scholar]
- Cassisi, S., & Salaris, M. 2013, Old Stellar Populations: how to study the fossil record of galaxy formation (Wiley-VCH) [Google Scholar]
- Cassisi, S., Salaris, M., Castelli, F., & Pietrinferni, A. 2004, ApJ, 616, 498 [NASA ADS] [CrossRef] [Google Scholar]
- Cassisi, S., Salaris, M., Pietrinferni, A., et al. 2008, ApJ, 672, L115 [NASA ADS] [CrossRef] [Google Scholar]
- Castelli, F. 2005, Mem. Soc. Astron. It., 8, 25 [Google Scholar]
- D’Ercole, A., D’Antona, F., & Vesperini, E. 2011, MNRAS, 415, 1304 [NASA ADS] [CrossRef] [MathSciNet] [Google Scholar]
- Dotter, A., Chaboyer, B., Ferguson, J. W., et al. 2007, ApJ, 666, 403 [NASA ADS] [CrossRef] [Google Scholar]
- Girardi, L., Bertelli, G., Bressan, A., et al. 2002, A&A, 391, 195 [NASA ADS] [CrossRef] [EDP Sciences] [Google Scholar]
- Gratton, R. G., Bonifacio, P., Bragaglia, A., et al. 2001, A&A, 369, 87 [NASA ADS] [CrossRef] [EDP Sciences] [Google Scholar]
- Gratton, R. G., Carretta, E., & Bragaglia, A. 2012, A&ARv, 20, 50 [CrossRef] [Google Scholar]
- Grundahl, F., Vandenberg, D. A., & Andersen, M. I. 1998, ApJ, 500, L179 [NASA ADS] [CrossRef] [Google Scholar]
- Grundahl, F., Catelan, M., Landsman, W. B., Stetson, P. B., & Andersen, M. I. 1999, ApJ, 524, 242 [NASA ADS] [CrossRef] [Google Scholar]
- Johnson, C. I., & Pilachowski, C. A. 2012, ApJ, 754, L38 [NASA ADS] [CrossRef] [Google Scholar]
- King, I. R., Bedin, L. R., Cassisi, S., et al. 2012, AJ, 144, 5 [NASA ADS] [CrossRef] [Google Scholar]
- Lee, H-c., Worthey, G., Dotter, A., et al. 2009, ApJ, 694, 902 [NASA ADS] [CrossRef] [Google Scholar]
- Marino, A. F., Villanova, S., Piotto, G., et al. 2008, A&A, 490, 625 [NASA ADS] [CrossRef] [EDP Sciences] [Google Scholar]
- Marino, A. F., Sneden, C., Kraft, R. P., et al. 2011, A&A, 532, A8 [NASA ADS] [CrossRef] [EDP Sciences] [Google Scholar]
- Marino, A. F., Milone, A. P., Sneden, C., et al. 2012, A&A, 541, A15 [NASA ADS] [CrossRef] [EDP Sciences] [Google Scholar]
- Milone, A. P., Bedin, L. R., Piotto, G., et al. 2008, ApJ, 673, 241 [NASA ADS] [CrossRef] [Google Scholar]
- Milone, A. P., Piotto, G., Bedin, L. R., et al. 2012a, ApJ, 744, 58 [NASA ADS] [CrossRef] [Google Scholar]
- Milone, A. P., Marino, A. F., Cassisi, S., et al. 2012b, ApJ, 754, L34 [NASA ADS] [CrossRef] [Google Scholar]
- Monelli, M., Milone, A. P., Marino, A. F., et al. 2013, MNRAS, 431, 2126 [NASA ADS] [CrossRef] [Google Scholar]
- Mucciarelli, A., Bellazzini, M., Ibata, R., et al. 2012, MNRAS, 426, 2889 [NASA ADS] [CrossRef] [Google Scholar]
- Pietrinferni, A., Cassisi, S., Salaris, M., & Castelli, F. 2004, ApJ, 612, 168 [NASA ADS] [CrossRef] [Google Scholar]
- Pietrinferni, A., Cassisi, S., Salaris, M., & Castelli, F. 2006, ApJ, 642, 797 [NASA ADS] [CrossRef] [Google Scholar]
- Pietrinferni, A., Cassisi, S., Salaris, M., Percival, S., & Ferguson, J. W. 2009, ApJ, 697, 275 [NASA ADS] [CrossRef] [Google Scholar]
- Piotto, G. 2010, Pub. Korean Astron. Soc., 25, 91 [Google Scholar]
- Piotto, G., Bedin, L. R., Anderson, J., et al. 2007, ApJ, 661, 53 [Google Scholar]
- Piotto, G., Milone, A. P., Anderson, J., et al. 2012, ApJ, 760, 39 [NASA ADS] [CrossRef] [Google Scholar]
- Salaris, M., Chieffi, A., & Straniero, O. 1993, ApJ, 414, 580 [NASA ADS] [CrossRef] [Google Scholar]
- Salaris, M., Weiss, A., Ferguson, J. W., & Fusilier, D. J. 2006, ApJ, 645, 1131 [NASA ADS] [CrossRef] [Google Scholar]
- Sbordone, L. 2005, Mem. Soc. Astron. It. Supp., 8, 61 [Google Scholar]
- Sbordone, L., Salaris, M., Weiss, A., & Cassisi, S. 2011, A&A, 534, A9 [NASA ADS] [CrossRef] [EDP Sciences] [Google Scholar]
- Strömgren, B. 1956, Vistas Astron., 2, 1336 [Google Scholar]
- VandenBerg, D. A., Bergbusch, P. A., Dotter, A., et al. 2012, ApJ, 755, 15 [NASA ADS] [CrossRef] [Google Scholar]
- Ventura, P., Caloi, V., D’Antona, F., et al. 2009, MNRAS, 399, 934 [NASA ADS] [CrossRef] [Google Scholar]
- Ventura, P., D’Antona, F., Di Criscienzo, M., et al. 2012, ApJ, 761, L30 [NASA ADS] [CrossRef] [Google Scholar]
All Tables
Mass and number fractions (normalized to unity) for the FG and the CNONa2MgAl metal mixtures.
Selected points along the “CNONa2MgAl” isochrone, chosen for the model atmosphere computations.
All Figures
|
Fig. 1 Left panel: evolutionary tracks for 0.8 M⊙ models and Z = 0.001, Y = 0.246 FG, and SG chemical compositions. An additional numerical experiment with modified opacity tables is also shown (see text for details). MS lifetimes are listed. Right panel: as left panel but with an enlargement of the MS-TO-SGB region. |
| In the text | |
|
Fig. 2 The three panels display a comparison of the abundances of our FG and CNONa2MgAl compositions (large filled circles) with selected observational data (from top to bottom): the [C/Fe]-[N/Fe] diagram (data for 47 Tuc and NGC 6752 from Briley et al. 2004; Carretta et al. 2005), [O/Fe]-[Na/Fe] diagram (data for several clusters from Carretta et al. 2009a), [Mg/Fe]–[Al/Fe] diagram (data for NGC 6752 from Carretta et al. 2012). |
| In the text | |
|
Fig. 3 Isochrones for an age of 12 Gyr and [Fe/H] = −1.61, under various assumptions about the metal mixture and the initial He abundance. The CNONa-MgAl label denotes the mixture with the C-N, Na-O and Mg-Al anticorrelations, and Y = 0.246; (CNO)enhNa denotes a mixture with C-N, Na-O anticorrelation, and the CNO sum enhanced by a factor of two with respect to the FG mixture – as in 42 – and Y = 0.246; (CNO)enhNa,He − rich denotes the same mixture as the (CNO)enhNa case, but with Y = 0.40. Filled circles mark selected points along the isochrones for which we show in the following the corresponding synthetic spectra. |
| In the text | |
|
Fig. 4 Isochrones for an age of 12 Gyr and [Fe/H] = −1.01, Y = 0.248, computed for both FG (dashed line) and “CNONa2MgAl” (solid line) chemical compositions. |
| In the text | |
|
Fig. 5 Top panel: flux distribution for the MS model with Teff = 4621 K and log (g) = 4.77 calculated with the CNONa2 (solid line) and the CNONa2MgAl (dotted line) metal compositions. The transmission curves for the Johnson-Cousins UBVI (thin black lines) and the Strömgren uvby filters (grey-shaded regions) are also shown. Bottom panel: relative flux difference between the two spectral energy distributions, as a function of the wavelength. |
| In the text | |
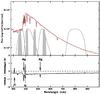 |
Fig. 6 As in Fig. 5 but for the TO model with Teff = 6490 K and log (g) = 4.22. |
| In the text | |
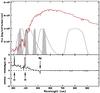 |
Fig. 7 As in Fig. 5 but for the RGB model with Teff = 4476 K and log (g) = 1.2. |
| In the text | |
|
Fig. 8 Difference ΔBC between the uvby bolometric corrections for a standard α-enhanced FG mixture and, respectively, the CNONa2 SG mixture (open circles) and the CNONa2MgAl SG mixture for the selected points of Table 2 (see text for details). |
| In the text | |
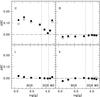 |
Fig. 9 As in Fig. 8, but for the UBVI filters. |
| In the text | |
Current usage metrics show cumulative count of Article Views (full-text article views including HTML views, PDF and ePub downloads, according to the available data) and Abstracts Views on Vision4Press platform.
Data correspond to usage on the plateform after 2015. The current usage metrics is available 48-96 hours after online publication and is updated daily on week days.
Initial download of the metrics may take a while.