Fig. 5
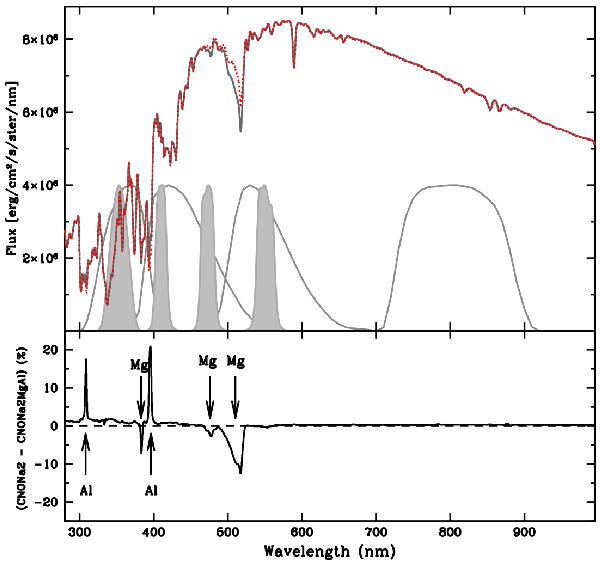
Top panel: flux distribution for the MS model with Teff = 4621 K and log (g) = 4.77 calculated with the CNONa2 (solid line) and the CNONa2MgAl (dotted line) metal compositions. The transmission curves for the Johnson-Cousins UBVI (thin black lines) and the Strömgren uvby filters (grey-shaded regions) are also shown. Bottom panel: relative flux difference between the two spectral energy distributions, as a function of the wavelength.
Current usage metrics show cumulative count of Article Views (full-text article views including HTML views, PDF and ePub downloads, according to the available data) and Abstracts Views on Vision4Press platform.
Data correspond to usage on the plateform after 2015. The current usage metrics is available 48-96 hours after online publication and is updated daily on week days.
Initial download of the metrics may take a while.