Fig. 2
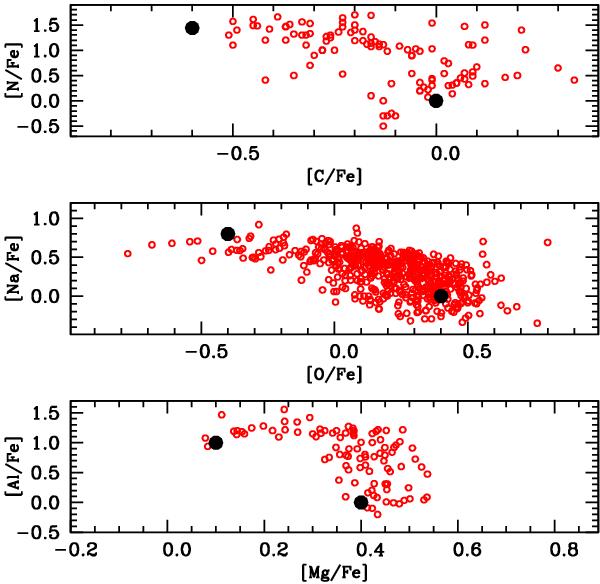
The three panels display a comparison of the abundances of our FG and CNONa2MgAl compositions (large filled circles) with selected observational data (from top to bottom): the [C/Fe]-[N/Fe] diagram (data for 47 Tuc and NGC 6752 from Briley et al. 2004; Carretta et al. 2005), [O/Fe]-[Na/Fe] diagram (data for several clusters from Carretta et al. 2009a), [Mg/Fe]–[Al/Fe] diagram (data for NGC 6752 from Carretta et al. 2012).
Current usage metrics show cumulative count of Article Views (full-text article views including HTML views, PDF and ePub downloads, according to the available data) and Abstracts Views on Vision4Press platform.
Data correspond to usage on the plateform after 2015. The current usage metrics is available 48-96 hours after online publication and is updated daily on week days.
Initial download of the metrics may take a while.