Free Access
Fig. 1
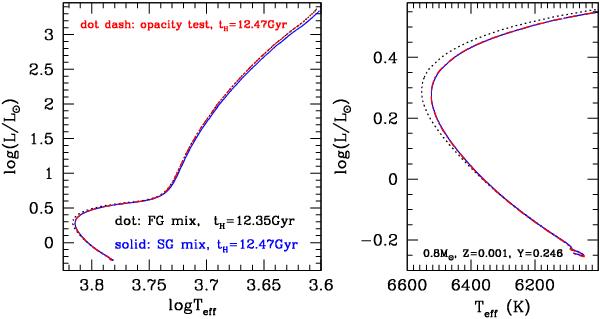
Left panel: evolutionary tracks for 0.8 M⊙ models and Z = 0.001, Y = 0.246 FG, and SG chemical compositions. An additional numerical experiment with modified opacity tables is also shown (see text for details). MS lifetimes are listed. Right panel: as left panel but with an enlargement of the MS-TO-SGB region.
Current usage metrics show cumulative count of Article Views (full-text article views including HTML views, PDF and ePub downloads, according to the available data) and Abstracts Views on Vision4Press platform.
Data correspond to usage on the plateform after 2015. The current usage metrics is available 48-96 hours after online publication and is updated daily on week days.
Initial download of the metrics may take a while.