| Issue |
A&A
Volume 554, June 2013
|
|
|---|---|---|
| Article Number | A3 | |
| Number of page(s) | 9 | |
| Section | Galactic structure, stellar clusters and populations | |
| DOI | https://doi.org/10.1051/0004-6361/201321029 | |
| Published online | 28 May 2013 | |
The open cluster IC 1805 and its vicinity: investigation of stars in the Vilnius, IPHAS, 2MASS, and WISE systems⋆
1 Institute of Theoretical Physics and Astronomy, Vilnius University, Goštauto 12, Vilnius 01108, Lithuania
e-mail: This email address is being protected from spambots. You need JavaScript enabled to view it.
2 Vatican Observatory, 00120 Citta del Vaticano, Italy
3 Jesuit University Ignatianum, Cracow, Poland
Received: 2 January 2013
Accepted: 29 March 2013
Abstract
The results of CCD photometry in the Vilnius seven-color system down to V = 18 mag are presented for 242 stars in the direction of the young open cluster IC 1805 that is located in the active star-forming region W4 in the Cas OB6 association. Photometric data were used to classify stars into spectral and luminosity classes, and to determine their interstellar reddenings, extinctions and distances. We confirm the CH3OH and H2O maser VLBA parallax results that the cluster is located close to the front side of the Perseus arm, at a distance about 2.0 kpc. In the color–magnitude diagram, zero-age main sequence (ZAMS) stars of the cluster extend to spectral class A0. The extinction values for the majority of the cluster stars are between 2.2 and 2.7 mag, with a mean value of 2.46 mag. This extinction originates mainly between the Sun and the outer edge of the Local arm, in accordance with the distribution of CO clouds. In the Perseus arm and beyond, the extinction was investigated using the classification and reddening determination for A0–F0 stars measured in the r, i, Hα system of the IPHAS survey to r = 19 mag. The extinction AV within the Perseus arm ranges from 2.5–4.5 mag at the front edge to 3.0–5.0 mag at the far edge. Possibly, we have found about 20 early A-type stars located in the Outer arm. The 2MASS JHKs photometry for red giants gives much higher extinction values (up to about 6 mag), which would correspond to the stars located behind dense clouds of both arms. In the area, using the WISE, 2MASS, and IPHAS photometry data, 18 possible young stellar objects (YSOs) of low masses are identified. Six high-mass YSOs (five Ae/Be stars and a F6e star) are known from previous investigations.
Key words: open clusters and associations: individual: IC 1805 / open clusters and associations: individual: Cas OB6 / stars: fundamental parameters / dust, extinction
Full Table 1 is only available at the CDS via anonymous ftp to cdsarc.u-strasbg.fr (130.79.128.5) or via http://cdsarc.u-strasbg.fr/viz-bin/qcat?J/A+A/554/A3
© ESO, 2013
1. Introduction
The young open cluster IC 1805 (known also as Melotte 15 and Collinder 26) is a part of the Cas OB6 association in the Perseus arm, located inside the H II region W4 (Heart nebula). The cluster center coincides with the binary O5 star HD 15558 (WDS J02327+6127AB) at RA = 02:32:42.5, Dec = +61:27:22, which itself is not a member of the cluster.
The cluster was investigated in several photometric systems: UBV or BV (Hoag et al. 1961; Blanco et al. 1968; Ishida 1969; Moffat 1972; Joshi & Sagar 2010; Kwon & Lee 1983; Sagar 1987; Guetter & Vrba 1989; Massey et al. 1995), BVRI (Ninkov et al. 1995), JHK or JHKL (Guetter & Vrba 1989; Sagar & Yu 1990, 2MASS Survey). (Wolff et al. 2011; Koenig et al. 2012) investigated young stellar object (YSO) population in the cluster area with Spitzer and WISE infrared photometry, respectively. Spectral types of the brightest stars in the cluster area, mostly of O–B spectral classes, were published by Morgan et al. (1955); Hiltner (1956); Hoag & Applequist (1965); Walker & Hodge (1968); Ishida (1970); Conti & Alschuler (1971); Walborn (1972, 1973); Kuznetsov (1984); Voroshilov et al. (1985); Garmany & Stencel (1992); Massey et al. (1995); Shi & Hu (1999). Membership probabilities for stars in the field of IC 1805 based on proper motions were investigated by Vasilevskis et al. (1965) and Sanders (1972). The stars with a high membership probability are scattered in a large field, up to 25′ from the center. However, most authors give its diameter between 20 and 25 arcmin, the concentration of stars to the center is rather low. Guetter & Vrba (1989) considered that the cluster might be defined as a subgroup of the association Cas OB6 rather than a cluster. A few O–B stars of the cluster were observed in the Vilnius seven-color photometric system by Sūdžius (1974) and Sūdžius & Bobinas (1992) as members of the association Cas OB6.
The Milky Way region in Cassiopeia containing the W3, W4, and W5 H II regions, and the star-forming history in this area have been described recently by Megeath et al. (2008).
The spectroscopic distance of IC 1805 was determined in most of the papers listed above. The results range from 1.9 to 2.4 kpc. The distance differences among the authors originate from the ambiguity of the accepted absolute magnitudes of O–B stars and the fitting procedure of the zero-age main sequence (ZAMS) line to the cluster sequence. More accurate distances to the star-forming region (1.95–2.04 kpc) were obtained by VLBA parallax measurements of CH3OH and H2O masers in the adjacent molecular cloud W3 (Xu et al. 2006; Hachisuka et al. 2006).
The age of IC 1805 has been found to be between 1 and 3 Myr, which means that only stars of spectral types O and B are expected to lie on the ZAMS of the HR diagram. Cluster stars of lower surface temperatures should be located on pre-main-sequence evolutionary tracks like in other clusters of similar age (see Massey et al. 1995; Wolff et al. 2011). Such stars usually have circumstellar envelopes or disks composed of gas and dust with different densities and exhibit radiation excesses in the infrared of different strength and energy distribution, which allow estimating their evolutionary stage (Lada 1987; Robitaille et al. 2006, 2007).
Interstellar reddening and extinction in the direction of IC 1805 was investigated by Kolesnik & Metreveli (1985) and Kolesnik (1988) using photographic BV photometry and one-dimensional spectral classes. Guetter & Vrba (1989) have plotted the extinction vs. distance diagram in the direction of IC 1805 using photoelectric UBV photometry and MK spectral types collected from the literature. These authors concluded that the interstellar reddening of the cluster originates in the Local arm up to a distance of 1 kpc and that the cluster is not deeply embedded in the Perseus arm. Most investigations found that the interstellar extinction in the direction of IC 1805 is inhomogeneous across the cluster region, with a mean value of AV close to 2.5 mag. According to Guetter & Vrba (1989), Sagar & Yu (1990), and Hanson & Clayton (1993), the extinction law in the direction of IC 1805 is normal.
Despite numerous investigations of the IC 1805 area, some questions remain to be answered. In most of the investigations the main object was the cluster itself, and the stars in the foreground and background of it have received less attention. Therefore, the interstellar extinction in this direction is not investigated in a wide range of distances with modern photometric methods. In estimating the extinction at different distances, the limiting magnitude effect has not been taken into account sufficiently. So far the total extinction in the Perseus arm behind IC 1805 is not known. We also need more information about the possible formation of low-mass stars in the cluster and the association Cas OB6. The question whether IC 1805 is a real cluster, needs to be answered.
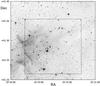 |
Fig. 1 Central part of the cluster IC 1805 observed in the Vilnius photometric system (14′ × 14′). A copy of the DSS2 Red map from SkyView. |
2. Observations and processing
CCD exposures with seven filters of the Vilnius photometric system were obtained in 2009 and 2012 with a 4K CCD camera on the 1.8 m VATT telescope on Mt. Graham, Arizona. We used the 88 mm square uby filters of the Strömgren system and the round 80 mm diameter PXZS filters of the Vilnius system. Since the three mentioned Strömgren filters have similar transmittance curves as the Vilnius filters U, Y, and V, all instrumental color indices, found as the differences of magnitudes, were transformed to the standard Vilnius system1.
The center of the area is at RA = 2h 32m 30s, Dec = +61° 28′. The area size is about 14′ × 14′ (Fig. 1). The standard field in the open cluster M 67 from Laugalys et al. (2004) was observed on the same nights to be used for flatfielding. The same cluster was used to determine the color equations applied to transform the instrumental magnitudes and colors to the standard Vilnius system. To fix the zero-points of magnitudes and color indices, photoelectric data of three stars (Nos. 35, 61, and 78 in Table 1) observed by Bartašiūtė & Laugalys (2004) were used. By definition, all color indices of the Vilnius system are normalized to zero for unreddened O-type stars.
The frames in each filter were taken with different exposure lengths to cover the range of V from ~9 to 18 mag. CCD frames were processed with IRAF2 in the aperture mode. The standard errors of color indices P–V, X–V, Y–V, Z–V and V–S down to V = 17 mag are ≤0.01 mag, for U–V the errors are usually larger by a factor of 1.5.
Table 1 lists the photometry results for 242 stars in the area down to V ≈ 18 mag. In the printed version of the paper only 20 stars from the beginning of the table are given. The full table is available at CDS. The columns give the running number, the Vasilevskis et al. (1965) and Massey et al. (1995) numbers3, the equatorial coordinates J2000.0 taken from the PPMXL catalog (Roeser et al. 2010), V magnitudes and color indices U–V, P–V, X–V, Y–V, Z–V and V–S of the Vilnius system, the photometric spectral types determined as described in the next section, and membership probabilities from proper motions (“m” means member and “pm” means possible member). For some stars color indices U–V and P–V are absent since these stars were too faint in the ultraviolet magnitudes U and P. Colons after these two color indices mean that their standard errors are between 0.05 and 0.10 mag. Some stars were excluded because of blending by close neighbors. Spectral classes are given in lower-case letters to show that they are obtained by photometric, not spectral, classification method. If the spectral type from spectroscopy was available, it is given instead of the photometric one, with the asterisk in front. If the star was classified by several authors, its spectral type corresponding to the highest spectrum resolution was accepted.
Beginning of the star data catalog in the IC 1805 area measured in the Vilnius seven-color system.
3. Photometric classification
For photometric classification of stars, the following method was applied. When all six color indices were available, the method used matching of 14 different interstellar reddening-free Q-parameters of a program star to those of about 8300 standard stars of various spectral and luminosity classes, metallicities, and peculiarity types from the General Photometric Catalog of Stars Observed in the Vilnius System (Straižys & Kazlauskas 1993) supplemented with new photoelectric observations. The Q-parameters are defined by the equation  (1)where m are the magnitudes in four (sometimes three, when m2 = m3) passbands, m1 − m2 and m3 − m4 are color indices, and E12 and E34 are corresponding color excesses. The E12/E34 ratio slightly depends on spectral type, and this dependence was taken into account by approximations: the mean ratios of color excesses – preliminary classification – the corrected ratios – new classification, etc. The ratios of color excesses corresponding to the normal interstellar reddening law were taken. The matching of Q-parameters leads to a selection of some standard stars with a set of Qs most similar to those of the program star. The match quality is characterized by
 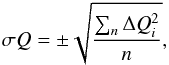 (2)where ΔQ are differences of corresponding Q-parameters of the program star and the standard star, n is a number of the compared Q-parameters (in our case, n = 14). For the stars observed with an accuracy of ±0.01 mag, the σQ value is about ±0.01–0.02 mag. In this case the match is considered to be good, and the MK spectral type (spectral class + luminosity class) of the standard star may be assigned to the program star. Usually, we accepted for the program star the average spectral and luminosity classes of the five best-matching stars weighted by (σQ)-1. If the matching accuracy ≥0.03 mag, the star remained not classified: such stars can be unresolved binaries or have peculiar spectral energy distributions.
Two-dimensional classification of K and M stars can be obtained even without U–V and P–V, containing the ultraviolet magnitudes U and P, and using only seven Q-parameters. Sometimes it is difficult to separate K and M stars, especially K5–K7 and M0–M2 dwarfs. In this case the 2MASS JHKs photometry helps. Recently, we have started to use the filter with λ0 = 714 nm, which measures the absorption in a strong TiO band. If the interstellar extinction in the field is low (AV < 0.5 mag), a two-color diagram Y–Z vs. Z–V can be used to separate K and M stars (Zdanavičius et al. 2012).
Stars with oblong or multiple images within 5′′ were excluded from the classification and subsequent analysis. These stars have the notes “bin” in the spectral type column of Table 1.
4. Color excesses and interstellar extinctions
When spectral and luminosity classes are known, one may calculate color excesses and extinctions of stars with the equations
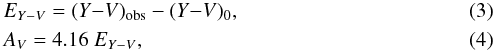 where (Y − V)0 are the intrinsic color indices from Straižys (1992).
To calculate color excesses for 39 stars in the area, mostly cluster members of spectral classes O and B, we used spectroscopic MK types. In Table 1 these spectral types are marked with asterisks.
Since our CCD field (14′ × 14′) does not cover the full cluster area, we supplemented the investigation with three stars of spectral classes O7–B1, cluster members from proper motions located outside our field but within 10′ from its center. Their numbers in Massey et al. (1995) are 25 (O8 Vf), 197 (O7 Vf), and 186 (B1 V). The extinctions AV for these stars were calculated using B,V photometry and spectral types from Massey et al.
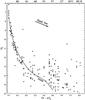 |
Fig. 2 Dereddened color–magnitude diagram for the IC 1805 area. Dots are the cluster members according to Sanders (1972), crosses are field stars, some of them are possible cluster members. The gray line is ZAMS from Kazlauskas et al. (2006) for a distance modulus of V0 − MV = 11.5. The length of the reddening line corresponds to EB − V = 0.2. |
5. Dereddened color–magnitude diagram of the cluster
In Fig. 2 we show the intrinsic color–magnitude diagram for all stars of the area with two-dimensional classification (plus three Massey et al. O7–B1 stars listed above) with the intrinsic color index (Y − V)0 (according to spectral type) on the x-axis and V0 = V − AV on the y-axis. Each star was dereddened individually. On the upper x-axis, the spectral classes corresponding to the intrinsic colors (Y − V)0, are shown. Dots denote the stars for which the cluster membership probability given by Sanders (1972) is ≥70%. The gray curve in Fig. 2 is the ZAMS line from Kazlauskas et al. (2006) drawn for a distance of 2.0 kpc or distance modulus V0 − MV = 11.5 mag. It fits the sequence of dereddened cluster members well.
The stars shown in Fig. 2 as crosses have either lower cluster membership probability than 70%, or the probability has not been estimated. Some of these stars, especially those lying close to the ZAMS line, can be considered as possible cluster members. However, some of them, which lie at the lower edge of the main sequence, can be background stars belonging to the Perseus arm. At a distance of this arm (from 2 to 3 kpc), the true distance modulus V0–MV varies from 11.5 to 12.4 mag. With the dispersion of the MV values, this difference in the distance moduli is not sufficient to separate cluster members and field stars of the same spectral types belonging to this arm. The stars at the upper edge of the main sequence can be foreground field stars, located at the outer edge of the Local arm, or unresolved binaries in the cluster.
6. Dependence of interstellar extinction on distance
Distances to the stars were calculated with the equation  (5)where MV for different spectral and luminosity classes are taken from Straižys (1992), (Appendix 1), with a correction –0.1 mag adjusting the absolute magnitude scale to the modern distance modulus of the Hyades, V − MV = 3.3 mag (Perryman et al. 1998). For the cluster IC 1805 members of spectral classes O and B, the ZAMS absolute magnitudes were applied. Spectroscopic MK types have been used when available. For the three additional O7–B1 stars from Massey et al. (1995), described at the end of Sect. 4, we used MV values for luminosity V, since their positions in the V0 vs. (Y − V)0 diagram (Fig. 2) are well above the ZAMS.
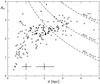 |
Fig. 3 Extinction vs. distance diagram for the stars classified in the Vilnius system. Dots are the IC 1805 members, crosses are field stars. The three curves show the limiting magnitude effect for A0 V, A5 V, and F0 V stars at V = 17 mag. The crosses of absolute errors are plotted at d = 1 and 2 kpc, corresponding to the distance errors for ΔMV = ± 0.5 mag and the extinction errors ±0.15 mag. |
In Fig. 3 the extinctions AV are plotted as a function of the distance d. Designations are the same as in Fig. 2. Owing to the dispersion of absolute magnitudes of individual stars, the 39 cluster members exhibit a wide spread in distances, from 1.2 to 2.8 kpc. If the true distance of the cluster is 2.0 kpc, this spread corresponds to ΔMV = ± 0.5 mag. This dispersion of absolute magnitudes seems to be realistic, taking into account the classification errors, possible age differences of individual stars, and the “cosmic dispersion” caused by other reasons. The spread in extinctions for most cluster members is between 2.2 and 2.7 mag, only three stars are at 3.2, 3.5, and 3.8 mag.
The distribution of stars in Fig. 3 shows that the extinction increases quite steeply starting from d = 300 pc to ~1 kpc. When the mean extinction ~2.5 mag is reached, it seems to remain at more or less the same level at larger distances. However, this “constancy” of extinction is illusory due to a strong selection effect originating from the limiting magnitude of the survey. In Fig. 3 this effect can be estimated by the three curves corresponding to limiting magnitude V = 17 mag for luminosity V stars of spectral classes A0, A5, and F0. It is evident that at a distance of the front edge of the Perseus arm (2 kpc) the stars cooler than F0 with AV = 2.5 mag are fainter than V = 17, thus they are rare in our catalog. With this limiting magnitude, only O, B, and A stars could be extinction tracers at larger distances; the field F–G–K dwarfs in the area are seen only up to ~2 kpc.
7. A0–F0 stars from the IPHAS survey
Interstellar extinction in the area up to higher distances and larger extinctions can be investigated applying A-type stars identified and classified with the help of the r–Hα vs. r–i diagram of the IPHAS survey (Fig. 4). The calibration of this diagram in MK spectral types (Drew et al. 2005) shows that the stars of early A-subclasses (A0–A5) with different reddenings do not overlap with stars of other types and can be applied to investigate the spatial distribution of stars and dust (Drew et al. 2008; Sale et al. 2009, 2010). The stars of spectral classes A6–F0 are overlapped only by reddened B-type stars, which in the direction of IC 1805 are mostly known and can be excluded. The remaining unrecognized B-stars are scarce and cannot significantly change the AV dependence on d. Therefore, to investigate interstellar extinction we decided to apply also the IPHAS group of A6–F0 stars.
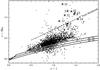 |
Fig. 4 IPHAS survey diagram r–Hα vs. r–i for 2630 stars in the area with a diameter of 15′ around the cluster center. The identified A0−A5 and A6–F0 stars are limited by the parabolic interstellar reddening curves. The broken line is the threshold line for T Tauri-type stars from Barentsen et al. (2011). The crosses with numbers are the probable YSOs from Table 2. The errors of magnitudes are ≤0.05 for normal stars and <0.06 for YSOs. |
We downloaded the results of IPHAS photometry of 2630 stars with r magnitudes between 13 and 19 in the area of a diameter of 15′ centered on IC 1805 from http://casu.ast.cam.ac.uk/surveys-projects/iphas. The A0−A5 and A6–F0 stars of the main-sequence belt were identified in the r–Hα vs. r–i diagram by applying the parabolic interstellar reddening curves shown in Fig. 6 of Sale et al. (2009). For A0−A5 stars the limiting equations are  For A6–F0 stars the limiting equations are
  The stars of luminosities V, IV, and III form the same sequence, so there is no possibility to segregate them into luminosity classes.
The extinctions and distances for the A0–A5 and A6–F0 stars, identified in Fig. 4, were calculated with the equations
![Mathematical equation: \begin{eqnarray} && A_{r} = 4.0\,[(r-i) - (r-i)_0],\\[2mm] && 5\,\log\,d = r - M_r +5 - A_{r},\\[2mm] && A_V = 1.20\,A_{r}. \end{eqnarray}](/articles/aa/full_html/2013/06/aa21029-13/aa21029-13-eq74.png) The ratio Ar/Er − i = 4.0 was calculated by synthetic photometry accepting a normal interstellar extinction law, which for B–A stars gives AV/EB − V = 3.2.
The ratio Ar/Er − i = 4.0 was calculated by synthetic photometry accepting a normal interstellar extinction law, which for B–A stars gives AV/EB − V = 3.2.
All selected stars were considered to be of luminosity class V. The following values of absolute magnitudes were accepted: Mr = +1.4 mag for A0–A5 stars and +2.35 mag for A6–F0 stars. The absolute magnitudes are based on the Hipparcos parallaxes (Perryman et al. 1998). The intrinsic color indices (r–i)0are taken from Sale et al. (2009) where they were calculated by synthetic photometry for the Atlas 9 stellar model atmospheres. For the A0–A5 and A6–F0 groups the average values of (r − i)0 = 0.04 and 0.12 were taken.
The resulting AV vs. d diagram for 447 stars is plotted in Fig. 5. The two broken curves show the limiting magnitude effect: the curve in the upper right corner corresponds to A3 V stars with the faintest limiting magnitude r = 19, and the left curve is for A8 V stars of the brightest limiting magnitude r = 13. Reddened B-type stars contaminating the A6–F0 group have been excluded. There are no common stars between Figs. 5 and 3 since A-type stars observed in the Vilnius system were too bright for IPHAS photometry.
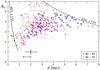 |
Fig. 5 Interstellar extinction AV as a function of distance in the IC 1805 area of a diameter of 15′ for stars in the A0–A5 (blue crosses) and A6–F0 (red dots) groups, considering that all of them belong to luminosity class V. The stars within rectangles a) and b) can be luminosity III or IV stars, see the text for discussion. The stars within rectangle c) can be late-type giants. The limiting magnitude curves for A3 V stars of r = 19 mag and for A8 V stars of r = 13 mag are shown. The arrow close to the x-axis shows the shift when a luminosity III star is considered to be of luminosity V. The absolute errors of distances at d = 2 kpc, shown in the error cross, are due to the acceptance of the mean values of absolute magnitudes for the groups A0–A5 and A6–F0. |
Before giving the interpretation of Fig. 5 we have to estimate the accuracy of the extinctions and distances. Our assumption that all stars in the sample belong to luminosity class V is evidently not true. The HR diagram for the solar vicinity stars with most accurate Hipparcos parallaxes given in Perryman et al. (1995) shows that the width of the main-sequence belt in absolute magnitudes in the A0–F0 range (B–V = 0.0−0.3) is about 2.5 mag. A similar result has been obtained for stars in open clusters (Meynet et al. 1993). Space density of stars in the main-sequence belt (luminosities V–IV–III) decreases with increasing luminosity, the highest density being in the lower portion of the belt, which extends from ZAMS to about 1 mag above it. The accepted absolute magnitudes for luminosity class V stars are about 1 mag more positive than the mean absolute magnitudes of luminosity class III stars, see Jaschek & Gómez (1998) and Gray et al. (2003). This means that the distances to luminosity class III stars, if we accept them to belong to luminosity V, are obtained too small by a factor of 1.58 (see the arrow in the lower part of Fig. 5). The absolute error bar of the distance, due to accepting of the mean values of absolute magnitudes for the groups A0–A5 and A6–F0, is also shown, together with the typical extinction error, ±0.2 mag.
Some stars in the A0–F0 belt are expected to be unresolved binaries. If both components are of the same spectral type, their common brightness is higher than of a single star by 0.75 mag, and the resulting distance becomes too small by a factor of 1.41. For the pairs of main-sequence stars with components of different spectral classes this factor is always smaller.
The effects of wrong luminosity class and duplicity mainly change the distance, while the extinction remains almost correct. Thus, in Fig. 5 some stars can be shifted to smaller distances at almost constant AV.
In general, the extinction run with distance in Fig. 5 is somewhat similar to that determined by the stars classified in the Vilnius system (Fig. 3). However, the IPHAS stars reach much larger distances and extinctions comparing with the Vilnius system. On the other hand, in Fig. 5 the AV vs. d dependence can be estimated only statistically since we attributed all stars to luminosity class V and used the mean absolute magnitudes and intrinsic colors for the A0–A5 and A6–F0 groups.
Here we give the interpretation of the extinction run with distance from the IPHAS data. In the A0–A5 and A6–F0 samples we see almost no stars with d < 0.5 kpc since the images of stars brighter than r = 13 mag in the IPHAS survey are saturated and these stars are excluded. A few stars appearing at d < 0.8 kpc, for example those within rectangle “a”, can be at wrong distances due to luminosity III or IV and possible duplicity. In reality, these stars can be more distant by a factor up to 1.6, i.e., they should be shifted to the right up to 0.9–1.1 kpc. The extinction values at the edge of the Local arm (1 kpc) are between 1.5 and 3 mag, which agrees well with Fig. 3. In the interarm space (1–2 kpc) the extinction remains constant, if we assume that a group of about 15 stars with d at 1.3–1.8 kpc and AV at 3.5–4.7 mag (within rectangle “b”) are luminosity IV and III stars or binaries, and they should be shifted to d ≈ 2.0 kpc.
In the Perseus arm at a distance of 2–3 kpc, we again observe a rise of the extinction from 2.5–4.5 mag at the front edge of the arm to 3–5 mag at its far edge near 3 kpc. A group of seven stars with AV above 5 mag (within rectangle “c”) can be either A-stars behind the densest parts of the dust clouds in the Perseus arm, or late-type giants with wrong extinctions and distances, contaminating the belt of reddened A-type stars in the r–Hα vs. r–i diagram. At larger distances the extinction seems to remain constant, but the number of stars decreases as the limiting magnitude (r = 19 mag) is approached. The stars at 6 kpc (only in the group A0–A5) probably belong to the Outer arm. However, the limiting magnitude of the IPHAS survey is insufficient to conclude about the extinction within the Outer arm.
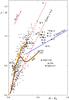 |
Fig. 6 J–H vs. H–Ks diagram for the 2MASS stars with errors of magnitudes ≤0.05 mag found in the 15′ × 15′ box centered on IC 1805. We show the main sequence (MS, brown belt), red giant branch (RGB, orange belt), the intrinsic locus of red clump giants (RCG) with its reddening line, the reddening line corresponding to QJHKs = 0 and the intrinsic T Tauri line. The Herbig Ae/Be stars (the crosses below the T Tauri line) are marked with numbers from Table 1 or from Massey et al. (1995). The probable low-mass YSOs (above the T Tauri line) are the crosses marked with numbers from Table 2. The red giant with the highest reddening is marked by A (see text). |
8. Slope of the reddening line in 2MASS two-color diagram
Important information about the cluster and its vicinity can be obtained from the near-infrared JHKs photometry of the 2MASS survey (Skrutskie et al. 2006). First, we applied this system to verify if the interstellar reddening law in the area is normal. Next, the system helped to identify pre-main-sequence (Herbig Ae/Be and T Tauri-type) stars.
Figure 6 shows the J–H vs. H-Ks diagram for 2MASS stars located in a 15′× 15′ field with the same center as our CCD area. Only stars with magnitude errors ≤0.05 mag were taken. The location of intrinsic sequences of luminosity classes V and III, and the intrinsic position of the red clump giants (RCGs) are shown according to Straižys & Lazauskaitė (2009). As was shown by Straižys & Laugalys (2009), the reddened RCGs, form a belt with a width of H–Ks = 0.1 mag running with a slope of EJ − H/EH − Ks = 2.0 due to cosmic dispersion (i.e., intrinsic dispersion of color indices caused by small differences in chemical and physical parameters) and observational errors. This belt completely covers the ascending branch of normal hydrogen-burning giants of spectral classes G5 to M5. It is true, however, that the space density of RCGs considerably outnumbers (by a factor of 10) the density of normal K–M III stars (Perryman et al. 1995, 1997; Alves 2000).
In Fig. 6 the stars on the reddening belt of RCGs and normal red giants extend up to J–H = 1.26, only one star is at 1.56. Because no giant exhibits higher reddening, the slope of the reddening line cannot be determined with good accuracy. However, it is evident that it is close to EJ − H/EH − Ks = 2.0, a value found in other galactic longitudes (Straižys et al. 2008; Straižys & Laugalys 2008). Thus, 2MASS photometry confirms the conclusion of Guetter & Vrba (1989) that the near-infrared interstellar reddening law in the direction of IC 1805 is close to normal.
The star at the upper end of the RCG + RGB reddening band marked by “A” is 2MASS J02332110+6126431 with J–H = 1.56, H–Ks = 0.62 located near the edge of our CCD field. Its Ks magnitude is 8.44, while the NOMAD catalog (Zacharias et al. 2004) gives its V = 17.61 mag. The star can hardly be an RCG since in this case it should have an extinction AV of ~9 mag, atypical in this direction. The star is probably a giant of spectral class M with AV close to 6 mag located in the Perseus arm.
9. Identification of pre-main-sequence stars
Herbig Ae/Be stars in the cluster area are known from spectroscopic classification, four of them, Nos. 52, 142, 162, and 184, with V magnitudes between 14 and 16 mag are present in Table 1.Three of them (spectral classes B8–A5) are probably close to the main sequence, while star No. 162 may be a massive YSO still on its horizontal (radiative) evolutionary track. These stars, and two more in close vicinity of our area (Nos. 128 and 137 in Massey et al. 1995), are also present in the Spitzer list of stars with IR excesses and thin disks (Wolff et al. 2011). In the J–H vs. H–Ks diagram, after dereddening, all of them should fall within the box of Ae/Be stars shown by Hernández et al. (2005). In Fig. 6 these six stars are marked with numbers from Table 1 and Massey et al. (1995), with the initials MJD.
T Tauri-type stars in the Perseus arm (with the expected interstellar extinction) are too faint to be present in our catalog. Therefore we will try to identify them using photometric data from the WISE, 2MASS, and IPHAS surveys.
To identify possible YSOs we applied a two-color diagram that combines the Ks magnitude from 2MASS and the magnitudes [3.4] and [4.6] from the WISE survey (Fig. 10 in Koenig et al. 2012). In the diagram Ks–[3.4] vs. [3.4]–[4.6], the interstellar reddening corrections should be taken into account. However, reddenings of objects in the vicinity of IC 1805 are moderate, and the corrections are insignificant. The Koenig et al. (2012) diagram allows us to identify YSOs of classes I (with envelopes) and II (with disks, T Tauri stars) separately.
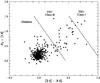 |
Fig. 7 Two-color diagram that combines the Ks magnitude of the 2MASS system and the magnitudes [3.4] and [4.6] of the WISE system, used to identify YSOs. We plot the stars in the 15′ × 15′ area centered on IC 1805, for which the magnitudes Ks, [3.4] and [4.6] have observational errors < 0.06 mag. The two straight lines taken from Koenig et al. (2012) divide the plane into three areas in which YSOs of types I and II and young diskless objects are located. |
In Fig. 7 we plot the WISE objects selected in the 15′ × 15′ area centered on IC 1805 from the Cutri et al. (2012) catalog. Only objects with errors of magnitudes Ks, [3.4] and [4.6] smaller than 0.06 mag were taken. Next, these stars have been plotted on the J–H vs. H–Ks diagram (Fig. 6) to check their location: 13 stars above the intrinsic T Tauri line and with H–Ks > 0.45 are suspected to be YSOs.
An additional possibility to identify YSOs comes from the r–Hα vs. r–i diagram of the IPHAS survey. From the WISE YSO candidates, in it we identified ten possible T Tauri stars above the “threshold” Hα emission line defined by Barentsen et al. (2011), see Fig. 4. Six of them coincide with those selected in the J–H vs. H–Ks diagram.
With the three identifications of YSOs from the diagrams Ks–[3.4] vs. [3.4]–[4.6] of WISE, J–H vs. H–Ks of 2MASS and r–Hα vs. r–i of IPHAS, we composed Table 2 with magnitudes and color indices of 18 probable T Tauri star candidates, five Ae/Be stars and one F6 Ve star. In Figs. 4 and 6 these stars are shown with numbers. It has been accepted that the star belongs to YSOs if this status is confirmed at least by two of the three listed diagrams. The selected T Tauri-type stars still remain candidates but with a higher confidence than from being identified using photometry from only one of the surveys.
Suspected YSOs in the IC 1805 area (15′ × 15′) identified in two-color diagrams of the WISE, 2MASS, and IPHAS surveys.
10. Discussion
The reddening-free V0 vs. (Y–V)0 diagram of Fig. 2 based on the Vilnius photometry and two-dimensional classification of O–B stars in the central region of the cluster IC 1805 is consistent with its distance of 2 kpc, which agrees with recent interferometric distances of CH3OH and H2O masers in the adjacent W3 H II region. This means that the cluster is located close to the near edge of the Perseus arm, and its interstellar extinction (AV = 2.5 mag) originates mainly in the Local arm. Figure 5 shows that this is the lowest value of the extinction detected in the Perseus arm by using A-stars from the IPHAS survey. Inside the Perseus arm (2–3 kpc from the Sun) the extinction AV continues to grow and at its far edge the extinction range is between 3.0 to 5.0 mag. Even higher values of the extinction are found by analyzing the reddening line of red giants in the J–H vs. H–Ks diagram (Fig. 6), where a few RCG and RGB stars show the extinctions up to 6 mag or even more.
An independent estimate of the extinction in the Local and the Perseus arms can be received from the distribution of CO molecules which are good dust tracers. Digel et al. (1996, Fig. 1) showed a plot of radial velocities of VLSR of CO against galactic longitudes in the range of ℓ = 132–144°. At ℓ = 134–135°, i.e., the longitude of the W3/W4 complex, two belts of CO corresponding to the Local arm (VLSR between 0.0 and –20 km s-1) and the Perseus arm (VLSR between –35 and –55 km s-1) are distinctly seen. A similar radial velocity pattern can be found in the Dame et al. (2001) CO survey. The CO radio lines in the Local arm are much stronger than in the Perseus arm: this is in accordance with the dust distribution obtained in the present investigation (AV ≈ 2.5 mag in the Local arm and ~0.5 mag in the Perseus arm.
As was suggested by Guetter & Vrba (1989), the IC 1805 cluster itself might be just a loose group of O–B stars belonging to the Cas OB6 association. According to the proper-motion study by Vasilevskis et al. (1965), the cluster members are scattered in a large field, up to 25′ from the center. Because of the low accuracy of absolute magnitudes estimated from MK spectral types, the distance errors at 2–3 kpc from the Sun are of the same order as the width of the Perseus arm. Therefore it is almost impossible to decide which stars are cluster members and which are more distant field stars.
Analyzing Vilnius and IPHAS photometry in the optical range and infrared photometry in the 2MASS and WISE surveys, we have tried to identify YSOs that are still on the convective tracks toward the main sequence. YSOs of large masses (Herbig Ae/Be stars) in IC 1805 are already known from the previous spectroscopic investigations and Spitzer photometry. Using the WISE results, Koenig et al. (2012) have identified many candidate YSOs in the W3/W4/W5 region. However, their list is not published. It is important to verify their evolutionary status by other methods. In the present work, we have identified 18 possible YSOs of T Tauri-type by combining the results from WISE, 2MASS, and IPHAS surveys. Most of these stars visually are fainter than the limit of our precise CCD photometry, with r mostly between 16.5 and 19.5 mag. The brightest of them are measurable with sufficient accuracy only in our green and red magnitudes, but in the ultraviolet and violet spectral range they are beyond the limiting magnitudes. The range of r magnitudes, given in Table 2, is consistent with T Tauri-type objects at a distance of 2 kpc with AV ≈ 2.5 mag. Thus, most of the selected stars should be YSOs of low masses.
The detected low-mass YSOs are scattered across the area, with no concentration at the center of the cluster or at the emission nebula in the left part of the area. Thus, these YSOs can be located either at a distance of the cluster or be the background objects. However, the Koenig et al. (2012) results agree that most of the suspected YSOs in the region exhibit clustering and should belong to the W3/W4/W5 star-forming complex. Consequently, the YSOs found in the vicinity of IC 1805 probably belong to the cluster, and this confirms that the low-mass star formation process is still ongoing.
11. Conclusions
Using photometry of 242 stars in the Vilnius seven-color system in the 14′× 14′ area of the young open cluster IC 1805, we have constructed the reddening-free color–magnitude diagram for the cluster members and confirmed its distance at 2.0 kpc, in a good agreement with the recent VLBA parallax measurements of masers. Each star was dereddened individually, applying spectral and luminosity classes, color excesses, and extinctions determined by photometric classification method with interstellar reddening-free Q-parameters.
The ZAMS stars in the HR diagram of the cluster extend approximately to spectral class A0 at V0 = 12.5 mag. The redder stars are either pre-main-sequence objects of the complex or field stars.
The mean interstellar extinction AV of the cluster stars (with three stars excluded) is found to be ~2.46 mag, in a good agreement with previous determinations in other photometric systems. The extinction originates mainly in the Local arm, because the cluster is located at the front edge of the Perseus arm.
The interstellar extinction at larger distances up to the Outer arm was investigated with the help of the IPHAS r, i and Hα system, which allowed us to isolate two groups of A-type stars, A0–A5 and A6–F0. We obtained that the extinction AV within the Perseus arm increases from 2.5–4.5 mag at its front edge to 3.0–5.0 mag at the far edge. We found about 20 early A-stars possibly located in the Outer arm. The 2MASS near-IR photometry shows that some distant giants in the Perseus arm behind the densest clouds have an extinction up to 6 mag.
Using the photometric data of the WISE, 2MASS, and IPHAS surveys, we identified 18 low-mass YSOs, probably T Tauri stars, in addition to the five massive Herbig Ae/Be stars, and one F6 Ve star, known earlier. Probably, most of the new YSOs belong to IC 1805 and its vicinity in the W4 H II region. This means that the star-forming process in the complex includes both high- and low-mass stars.
The reality of the IC 1805 cluster is still debated because the concentration of stars at its center is quite loose.
For the description of the medium-band Vilnius photometric system see Straižys (1992) monograph.
The Massey et al. (1995) numbers are given in the CDS catalog data for IC 1805/Cas OB6 at J/ApJ/454/151/ic1805.
Acknowledgments
The use of the Simbad, IPHAS, SkyView, and IRSA’s Gator databases is acknowledged. We are grateful to the anonymous referee for important comments and to Edmundas Meištas for his help in preparing the figures. V. L. acknowledges his postdoctoral fellowship funded by the European Union Structural Funds project “Postdoctoral Fellowship Implementation in Lithuania”.
References
- Alves, D. R. 2000, ApJ, 539, 732 [NASA ADS] [CrossRef] [MathSciNet] [Google Scholar]
- Barentsen, G., Vink, J. S., Drew, J. E., et al. 2011, MNRAS, 415, 103 [NASA ADS] [CrossRef] [Google Scholar]
- Bartašiūtė, S., & Laugalys, V. 2004, unpublished [Google Scholar]
- Blanco, V. M., Demers, S., Douglass, G. G., & FitzGerald, M. P. 1968, Publ. US Naval Obs., 21, 1 [NASA ADS] [Google Scholar]
- Conti, P. S., & Alschuler, W. R. 1971, ApJ, 170, 325 [NASA ADS] [CrossRef] [Google Scholar]
- Cutri, R. M., Wright, E. L., Conrow, T., et al. 2012, WISE All-Sky Data Release (Cutri+ 2012), CDS Catalogue II/311 [Google Scholar]
- Dame, T. M., Hartmann, D., & Thaddeus, P. 2001, ApJ, 547, 792 [NASA ADS] [CrossRef] [Google Scholar]
- Digel, S. W., Lyder, D. A., Philbrick, A. J., et al. 1996, ApJ, 458, 561 [NASA ADS] [CrossRef] [Google Scholar]
- Drew, J. E., Greimel, R., Irwin, M. J., et al. 2005, MNRAS, 362, 753 [NASA ADS] [CrossRef] [Google Scholar]
- Drew, J. E., Greimel, R., Irwin, M. J., & Sale, S. E. 2008, MNRAS, 386, 1761 [NASA ADS] [CrossRef] [Google Scholar]
- Garmany, C. D., & Stencel, R. E. 1992, A&AS, 94, 211 [NASA ADS] [Google Scholar]
- Gray, R. O., Corbally, C. J., Garrison, R. F., et al. 2003, AJ, 126, 2048 [NASA ADS] [CrossRef] [Google Scholar]
- Guetter, H. H., & Vrba, F. J. 1989, AJ, 98, 611 [NASA ADS] [CrossRef] [Google Scholar]
- Hachisuka, K., Brunthaler, A., Menten, K. M., et al. 2006, ApJ, 645, 337 [NASA ADS] [CrossRef] [Google Scholar]
- Hanson, M. M., & Clayton, G. C. 1993, AJ, 106, 1947 [NASA ADS] [CrossRef] [Google Scholar]
- Hernández, J., Calvet, N., Hartmannn, L., et al. 2005, AJ, 129, 856 [NASA ADS] [CrossRef] [Google Scholar]
- Hiltner, W. A. 1956, ApJS, 2, 389 [NASA ADS] [CrossRef] [Google Scholar]
- Hoag, A. A., & Applequist, N. L. 1965, ApJS, 12, 215 [NASA ADS] [CrossRef] [Google Scholar]
- Hoag, A. A., Johnson, H. L., Iriarte, B., et al. 1961, Publ. US Naval Obs., 17, 344 [Google Scholar]
- Ishida, K. 1969, MNRAS, 144, 55 [NASA ADS] [Google Scholar]
- Ishida, K. 1970, PASJ, 22, 277 [Google Scholar]
- Jaschek, C., & Gómez, A. E. 1998, A&A, 330, 619 [NASA ADS] [Google Scholar]
- Joshi, U. C., & Sagar, R. 2010, JRASC, 77, 40 [NASA ADS] [Google Scholar]
- Kazlauskas, A., Straižys, V., Bartašiūtė, S., et al. 2006, Baltic Astron., 15, 511 [NASA ADS] [Google Scholar]
- Koenig, X. P., Leisawitz, D. T., Benford, D. J., et al. 2012, ApJ, 744, 130 [NASA ADS] [CrossRef] [Google Scholar]
- Kolesnik, L. N. 1988, Kinematika i fizika nebesnykh tel, 4, 13 [NASA ADS] [Google Scholar]
- Kolesnik, L. N., & Metreveli, M. D. 1985, Kinematika i fizika nebesnykh tel, 1, 53 [NASA ADS] [Google Scholar]
- Kuznetsov, V. I. 1984, Astrometriia i Astrofizika, 53, 34 [NASA ADS] [Google Scholar]
- Kwon, S. M., & Lee, S. W. 1983, J. Korean Astron. Soc., 16, 7 [NASA ADS] [Google Scholar]
- Lada, C. J. 1987, in Star Forming Regions, eds. M. Peimbert, & J. Jugaku, IAU Symp., 115, 1 [Google Scholar]
- Laugalys, V., Kazlauskas, A., Boyle, R. P., et al. 2004, Baltic Astron., 13, 1 [NASA ADS] [Google Scholar]
- Massey, P., Johnson, K. E., & DeGioia-Eastwood, K. 1995, ApJ, 454, 151 [NASA ADS] [CrossRef] [Google Scholar]
- Megeath, S. T., Townsley, L. K., Oey, M. S., & Tieftrunk, A. R. 2008, Handbook of Star Forming Regions, ed. B. Reipurth, I, 264 [Google Scholar]
- Meynet, G., Mermilliod, J. C., & Maeder, A. 1993, A&AS, 98, 477 [NASA ADS] [Google Scholar]
- Moffat, A. F. J. 1972, A&AS, 7, 355 [NASA ADS] [Google Scholar]
- Morgan, W. W., Code, A. D., & Whitford, A. E. 1955, ApJS, 2, 41 [NASA ADS] [CrossRef] [Google Scholar]
- Ninkov, Z., Bretz, D. R., & Easton, R. L. 1995, AJ, 110, 2242 [NASA ADS] [CrossRef] [Google Scholar]
- Perryman, M. A. C., Lindegren, L., Kovalevsky, J., et al. 1995, A&A, 304, 69 [NASA ADS] [Google Scholar]
- Perryman, M. A. C., Lindegren, L., Kovalevsky, J., et al. 1997, A&A, 323, L49 [NASA ADS] [Google Scholar]
- Perryman, M. A. C., Brown, A. G. A., Lebreton, Y., et al. 1998, A&A, 331, 81 [NASA ADS] [Google Scholar]
- Robitaille, T. P., Whitney, B. A., Indebetouw, R., et al. 2006, ApJS, 167, 256 [NASA ADS] [CrossRef] [Google Scholar]
- Robitaille, T. P., Whitney, B. A., Indebetouw, R., & Wood, K. 2007, ApJS, 169, 328 [NASA ADS] [CrossRef] [Google Scholar]
- Roeser, S., Demleitner, M., & Schilbach, E. 2010, AJ, 139, 2440 [NASA ADS] [CrossRef] [Google Scholar]
- Sagar, R. 1987, MNRAS, 228, 483 [NASA ADS] [Google Scholar]
- Sagar, R., & Yu, Q. Z. 1990, ApJ, 353, 174 [NASA ADS] [CrossRef] [Google Scholar]
- Sale, S. E., Drew, J. E., Unruh, Y. C., et al. 2009, MNRAS, 392, 497 [NASA ADS] [CrossRef] [Google Scholar]
- Sale, S. E., Drew, J. E., Knigge, C., et al. 2010, MNRAS, 402, 713 [NASA ADS] [CrossRef] [Google Scholar]
- Sanders, W. L. 1972, A&A, 16, 58 [NASA ADS] [Google Scholar]
- Shi, H. M., & Hu, J. Y. 1999, A&AS, 136, 313 [NASA ADS] [CrossRef] [EDP Sciences] [Google Scholar]
- Skrutskie, M. F., Cutri, R. M., Stiening, R., et al. 2006, AJ, 131, 1163 [NASA ADS] [CrossRef] [Google Scholar]
- Straižys, V. 1992, Multicolor Stellar Photometry (Tucson, Arizona: Pachart Publishing House), available in pdf format from http://www.itpa.lt/MulticolorStellarPhotometry/ [Google Scholar]
- Straižys, V., & Kazlauskas, A. 1993, Baltic Astron., 2, 1 [NASA ADS] [Google Scholar]
- Straižys, V., & Lazauskaitė, R. 2009, Baltic Astron., 18, 19 [Google Scholar]
- Straižys, V., & Laugalys, V. 2008, Baltic Astron., 17, 253 [NASA ADS] [Google Scholar]
- Straižys, V., & Laugalys, V. 2009, Baltic Astron., 18, 141 [NASA ADS] [Google Scholar]
- Straižys, V., Corbally, C. J., & Laugalys, V. 2008, Baltic Astron., 17, 125 [Google Scholar]
- Sūdžius, J. 1974, Bull. Vilnius Obs., 39, 11 [NASA ADS] [Google Scholar]
- Sūdžius, J., & Bobinas, V. 1992, Bull. Vilnius Obs., 86, 59 [NASA ADS] [Google Scholar]
- Vasilevskis, S., Sanders, W. L., & Van Altena, W. F. 1965, AJ, 70, 806 [NASA ADS] [CrossRef] [Google Scholar]
- Voroshilov, V. I., Guseva, N. G., Kalandadze, N. B., et al. 1985, Catalog of BV magnitudes and spectral classes of 6000 stars (Naukova Dumka, Kiev) [Google Scholar]
- Walborn, N. R. 1972, AJ, 77, 312 [NASA ADS] [CrossRef] [Google Scholar]
- Walborn, N. R. 1973, AJ, 78, 1067 [NASA ADS] [CrossRef] [Google Scholar]
- Walker, G. A. H., & Hodge, S. M. 1968, PASP, 80, 290 [NASA ADS] [CrossRef] [Google Scholar]
- Wolff, S. C., Strom, S. E., & Rebull, L. M. 2011, ApJ, 726, 19 [NASA ADS] [CrossRef] [Google Scholar]
- Xu, Y., Reid, M. J., Zheng, X. W., & Menten, K. M. 2006, Science, 311, 54 [NASA ADS] [CrossRef] [PubMed] [Google Scholar]
- Zacharias, N., Monet, D. G., Levine, S. E., et al. 2004, BAAS, 36, 1418, CDS Catalogue I/297 [Google Scholar]
- Zdanavičius, K., Straižys, V., Zdanavičius, J., et al. 2012, A&A, 544, A49 [NASA ADS] [CrossRef] [EDP Sciences] [Google Scholar]
All Tables
Beginning of the star data catalog in the IC 1805 area measured in the Vilnius seven-color system.
Suspected YSOs in the IC 1805 area (15′ × 15′) identified in two-color diagrams of the WISE, 2MASS, and IPHAS surveys.
All Figures
|
Fig. 1 Central part of the cluster IC 1805 observed in the Vilnius photometric system (14′ × 14′). A copy of the DSS2 Red map from SkyView. |
| In the text | |
|
Fig. 2 Dereddened color–magnitude diagram for the IC 1805 area. Dots are the cluster members according to Sanders (1972), crosses are field stars, some of them are possible cluster members. The gray line is ZAMS from Kazlauskas et al. (2006) for a distance modulus of V0 − MV = 11.5. The length of the reddening line corresponds to EB − V = 0.2. |
| In the text | |
|
Fig. 3 Extinction vs. distance diagram for the stars classified in the Vilnius system. Dots are the IC 1805 members, crosses are field stars. The three curves show the limiting magnitude effect for A0 V, A5 V, and F0 V stars at V = 17 mag. The crosses of absolute errors are plotted at d = 1 and 2 kpc, corresponding to the distance errors for ΔMV = ± 0.5 mag and the extinction errors ±0.15 mag. |
| In the text | |
|
Fig. 4 IPHAS survey diagram r–Hα vs. r–i for 2630 stars in the area with a diameter of 15′ around the cluster center. The identified A0−A5 and A6–F0 stars are limited by the parabolic interstellar reddening curves. The broken line is the threshold line for T Tauri-type stars from Barentsen et al. (2011). The crosses with numbers are the probable YSOs from Table 2. The errors of magnitudes are ≤0.05 for normal stars and <0.06 for YSOs. |
| In the text | |
|
Fig. 5 Interstellar extinction AV as a function of distance in the IC 1805 area of a diameter of 15′ for stars in the A0–A5 (blue crosses) and A6–F0 (red dots) groups, considering that all of them belong to luminosity class V. The stars within rectangles a) and b) can be luminosity III or IV stars, see the text for discussion. The stars within rectangle c) can be late-type giants. The limiting magnitude curves for A3 V stars of r = 19 mag and for A8 V stars of r = 13 mag are shown. The arrow close to the x-axis shows the shift when a luminosity III star is considered to be of luminosity V. The absolute errors of distances at d = 2 kpc, shown in the error cross, are due to the acceptance of the mean values of absolute magnitudes for the groups A0–A5 and A6–F0. |
| In the text | |
|
Fig. 6 J–H vs. H–Ks diagram for the 2MASS stars with errors of magnitudes ≤0.05 mag found in the 15′ × 15′ box centered on IC 1805. We show the main sequence (MS, brown belt), red giant branch (RGB, orange belt), the intrinsic locus of red clump giants (RCG) with its reddening line, the reddening line corresponding to QJHKs = 0 and the intrinsic T Tauri line. The Herbig Ae/Be stars (the crosses below the T Tauri line) are marked with numbers from Table 1 or from Massey et al. (1995). The probable low-mass YSOs (above the T Tauri line) are the crosses marked with numbers from Table 2. The red giant with the highest reddening is marked by A (see text). |
| In the text | |
|
Fig. 7 Two-color diagram that combines the Ks magnitude of the 2MASS system and the magnitudes [3.4] and [4.6] of the WISE system, used to identify YSOs. We plot the stars in the 15′ × 15′ area centered on IC 1805, for which the magnitudes Ks, [3.4] and [4.6] have observational errors < 0.06 mag. The two straight lines taken from Koenig et al. (2012) divide the plane into three areas in which YSOs of types I and II and young diskless objects are located. |
| In the text | |
Current usage metrics show cumulative count of Article Views (full-text article views including HTML views, PDF and ePub downloads, according to the available data) and Abstracts Views on Vision4Press platform.
Data correspond to usage on the plateform after 2015. The current usage metrics is available 48-96 hours after online publication and is updated daily on week days.
Initial download of the metrics may take a while.