Fig. 2
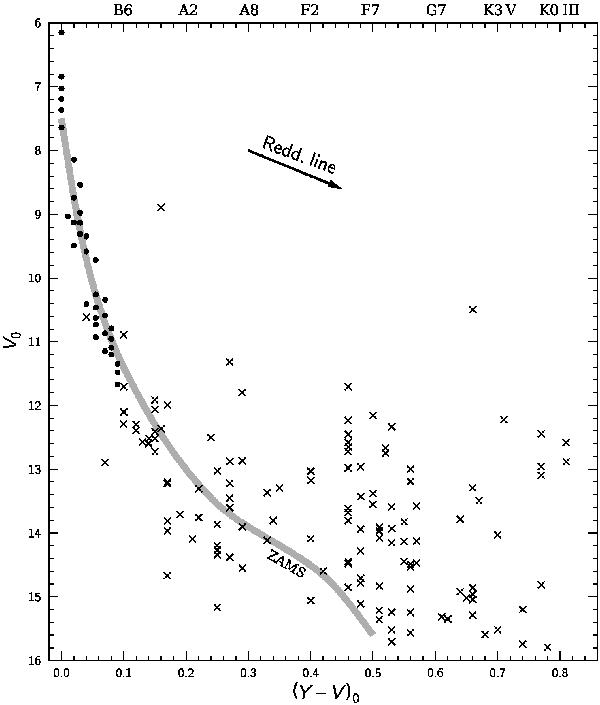
Dereddened color–magnitude diagram for the IC 1805 area. Dots are the cluster members according to Sanders (1972), crosses are field stars, some of them are possible cluster members. The gray line is ZAMS from Kazlauskas et al. (2006) for a distance modulus of V0 − MV = 11.5. The length of the reddening line corresponds to EB − V = 0.2.
Current usage metrics show cumulative count of Article Views (full-text article views including HTML views, PDF and ePub downloads, according to the available data) and Abstracts Views on Vision4Press platform.
Data correspond to usage on the plateform after 2015. The current usage metrics is available 48-96 hours after online publication and is updated daily on week days.
Initial download of the metrics may take a while.