Fig. 4
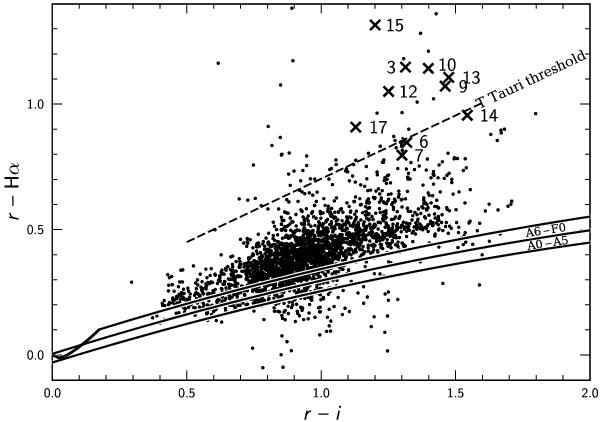
IPHAS survey diagram r–Hα vs. r–i for 2630 stars in the area with a diameter of 15′ around the cluster center. The identified A0−A5 and A6–F0 stars are limited by the parabolic interstellar reddening curves. The broken line is the threshold line for T Tauri-type stars from Barentsen et al. (2011). The crosses with numbers are the probable YSOs from Table 2. The errors of magnitudes are ≤0.05 for normal stars and <0.06 for YSOs.
Current usage metrics show cumulative count of Article Views (full-text article views including HTML views, PDF and ePub downloads, according to the available data) and Abstracts Views on Vision4Press platform.
Data correspond to usage on the plateform after 2015. The current usage metrics is available 48-96 hours after online publication and is updated daily on week days.
Initial download of the metrics may take a while.