Fig. 2
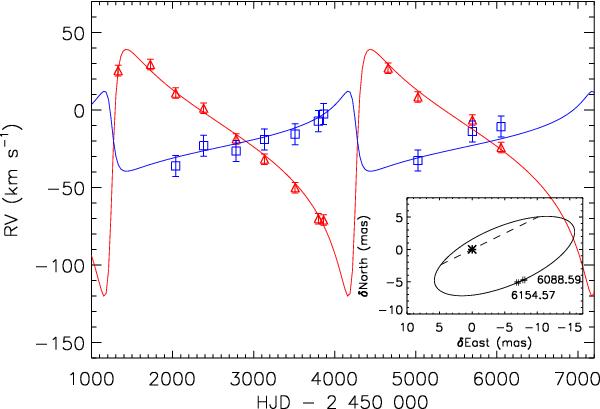
Main panel: evolution of the third component RVs (triangles) and of the systemic velocity of the O+O inner system (squares) as a function of time. The best-fit RV curves are overlaid (Table 5). Insert: PIONIER astrometric points and projection of the best-fit relative orbit on the plane of the sky. The dashed line shows the line of nodes.
Current usage metrics show cumulative count of Article Views (full-text article views including HTML views, PDF and ePub downloads, according to the available data) and Abstracts Views on Vision4Press platform.
Data correspond to usage on the plateform after 2015. The current usage metrics is available 48-96 hours after online publication and is updated daily on week days.
Initial download of the metrics may take a while.