Fig. 4
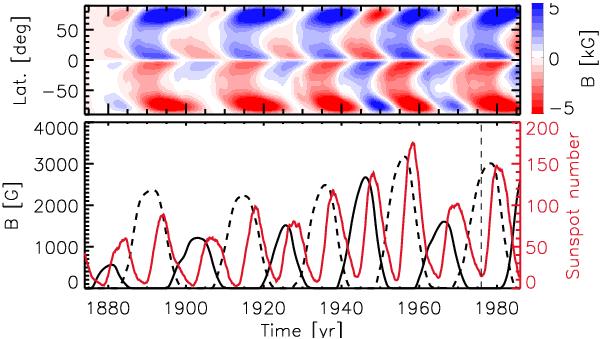
Toroidal field at the base of the convection zone (r = 0.7 R⊙). The upper panel shows the evolution as a function of latitude and time. In the lower panel the average unsigned toroidal flux between ± 45° latitude corresponding to odd and even cycles is shown using dashed and solid curves, respectively. The correlation coefficient between the maxima of the toroidal field at the base of the convection zone and the maxima of the observed sunspot number for cycles 15−21 is 0.93.
Current usage metrics show cumulative count of Article Views (full-text article views including HTML views, PDF and ePub downloads, according to the available data) and Abstracts Views on Vision4Press platform.
Data correspond to usage on the plateform after 2015. The current usage metrics is available 48-96 hours after online publication and is updated daily on week days.
Initial download of the metrics may take a while.