Free Access
Fig. 1
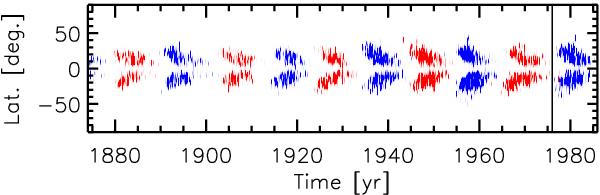
Source term, S(r,θ,t)sin(θ) at r = R⊙ for the poloidal flux based on the RGO sunspot record. The factor of sinθ is included to make the figure proportional to the amount of signed flux. The red and blue colors indicate positive and negative signs of A, respectively. Data after 1977 is from the SOON network.
Current usage metrics show cumulative count of Article Views (full-text article views including HTML views, PDF and ePub downloads, according to the available data) and Abstracts Views on Vision4Press platform.
Data correspond to usage on the plateform after 2015. The current usage metrics is available 48-96 hours after online publication and is updated daily on week days.
Initial download of the metrics may take a while.