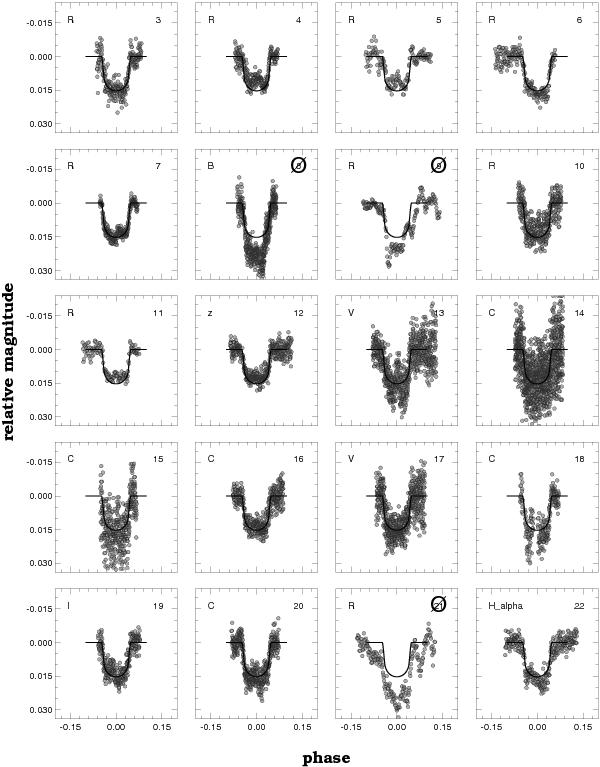
Fig. A.3

Light curves for the first half of the dataset as listed in Table 1. Phase was computed from the ephemeris given for the full dataset in Table 2. The light curves were linearly detrended as described in Sect. 3. The filters and the internal identification numbers (see Table 1) are given in each panel in the upper left and right corners, respectively (the sign ? is overplotted on the internal ID if the light curve is not included in the analysis presented in this paper). The reference model light curve is plotted by continuous line in each panel. Since the main purpose of the plot to display primarily the ETD light curves, for simplicity we left out #01 (HATNet), #02 (FLWO) and #30 (Konkoly), shown in other figures in the paper.
Current usage metrics show cumulative count of Article Views (full-text article views including HTML views, PDF and ePub downloads, according to the available data) and Abstracts Views on Vision4Press platform.
Data correspond to usage on the plateform after 2015. The current usage metrics is available 48-96 hours after online publication and is updated daily on week days.
Initial download of the metrics may take a while.


