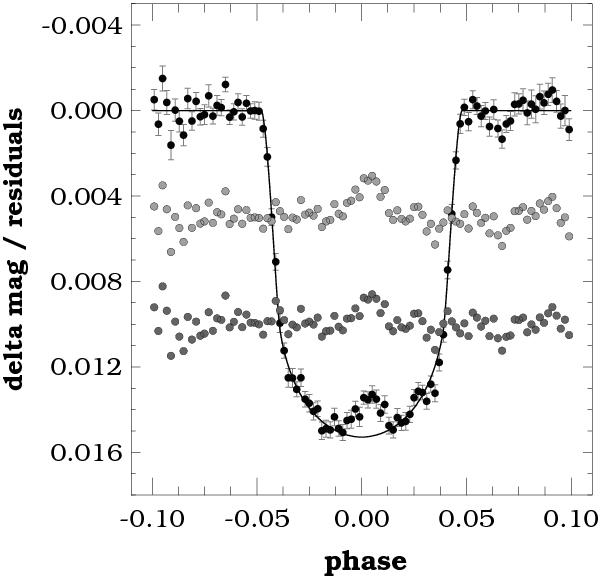
Fig. 10

Transit light curve obtained by summing up 32 light curves (see non-flagged items in Table 1). We combined the data in 0.002 phase units. Error bars show the ±1σ ranges of the bin averages. Continuous line shows the reference model light curve (see text). The dots in the middle of the plot show the residuals (arbitrarily shifted) for the dataset without prewhitening by the δ Scuti components (light-shaded filled circles) and for the prewhitened one (dark-shaded filled circles).
Current usage metrics show cumulative count of Article Views (full-text article views including HTML views, PDF and ePub downloads, according to the available data) and Abstracts Views on Vision4Press platform.
Data correspond to usage on the plateform after 2015. The current usage metrics is available 48-96 hours after online publication and is updated daily on week days.
Initial download of the metrics may take a while.


