Fig. 4
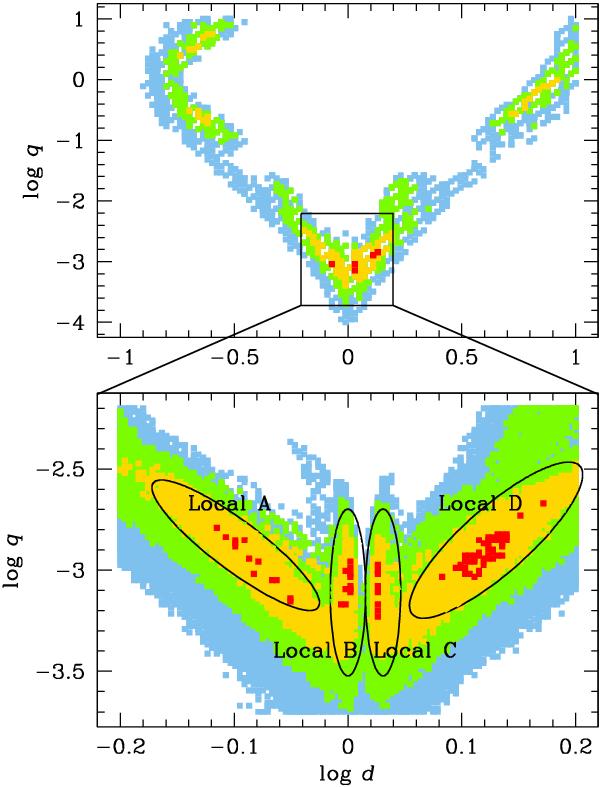
χ2 map in the d,q plane, showing the location of the four local minima identified by our modelling runs. Out of these, local minima A and D are competitive, with local minima B and C having Δχ2 ~ 50 and 70 respectively, for the same number of parameters. Minima A and D correspond to the close and wide ESBL + parallax models discussed in the text. Different colours correspond to Δχ2 < 25 (red), 100 (yellow), 225 (green), and 400 (blue); we note that the χ2 map is based on the original data, before error-bar normalisation, and therefore the Δχ2 levels are slightly different from those given in Table 2. The top panel shows the breadth of our parameter space exploration, encompassing planetary and non-planteray mass-ratio regimes, while the bottom panel shows a zoom on the region where our local minima are located.
Current usage metrics show cumulative count of Article Views (full-text article views including HTML views, PDF and ePub downloads, according to the available data) and Abstracts Views on Vision4Press platform.
Data correspond to usage on the plateform after 2015. The current usage metrics is available 48-96 hours after online publication and is updated daily on week days.
Initial download of the metrics may take a while.