Fig. 23
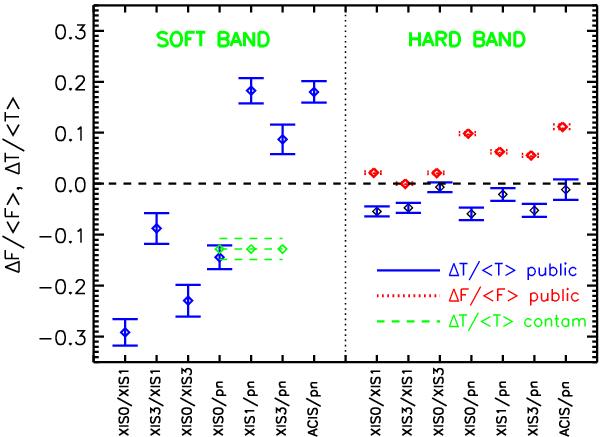
Average relative difference (diamonds) ± the error of the mean of the temperatures (solid line) and fluxes (dotted line) using the public calibration in the soft band (left side of the plot) and in the hard band (right side of the plot). Comparison of the pn and XIS soft band temperature using the modification to the contaminant is shown with diamonds and dashed lines.
Current usage metrics show cumulative count of Article Views (full-text article views including HTML views, PDF and ePub downloads, according to the available data) and Abstracts Views on Vision4Press platform.
Data correspond to usage on the plateform after 2015. The current usage metrics is available 48-96 hours after online publication and is updated daily on week days.
Initial download of the metrics may take a while.