Fig. 2
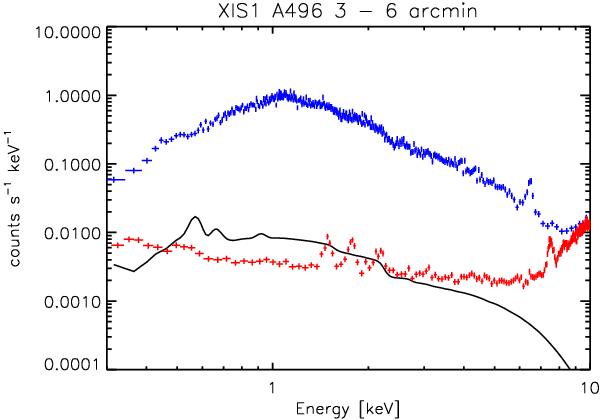
Total emission (blue crosses), sky background (black curve), and non X-ray background (red crosses) emission of A496 in the 3–6 arcmin region for XIS1. The sky background is modelled from ROSAT All Sky Survey data and folded through the XIS1 response. The XIS1 observation of A496 has the strongest relative background emission of the cluster sample.
Current usage metrics show cumulative count of Article Views (full-text article views including HTML views, PDF and ePub downloads, according to the available data) and Abstracts Views on Vision4Press platform.
Data correspond to usage on the plateform after 2015. The current usage metrics is available 48-96 hours after online publication and is updated daily on week days.
Initial download of the metrics may take a while.