Fig. 1
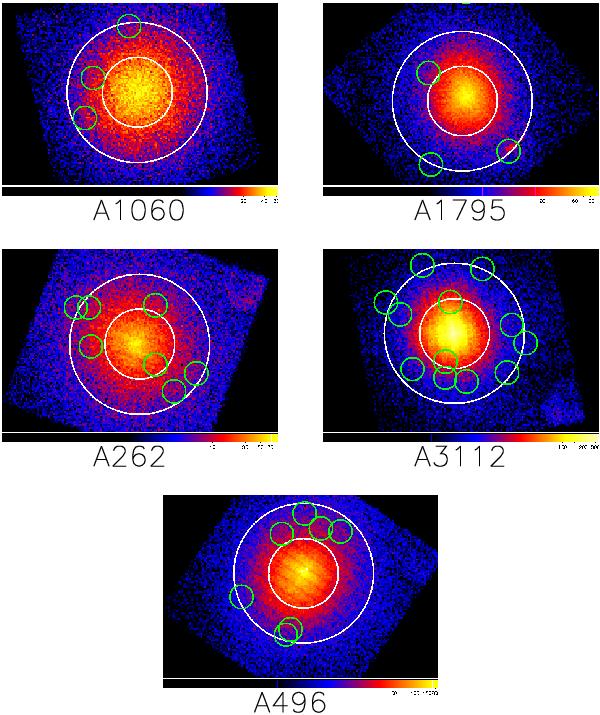
XIS1 raw count rate maps (not corrected for background or vignetting) of the soft band cluster sample in a 0.5–7.0 keV energy band binned to 8 pixels (~0.14 arcmin) per bin. The inner and outer radii of the 3–6 arcmin extraction region are denoted by white circles, the green circles show the excluded regions centred on point sources seen in XMM-Newton/EPIC-pn images. Scaling of the maps is adjusted for clarity and does not reflect the relative brightness of the clusters. The colour bar shows the the total number of counts per bin.
Current usage metrics show cumulative count of Article Views (full-text article views including HTML views, PDF and ePub downloads, according to the available data) and Abstracts Views on Vision4Press platform.
Data correspond to usage on the plateform after 2015. The current usage metrics is available 48-96 hours after online publication and is updated daily on week days.
Initial download of the metrics may take a while.