Fig. 13
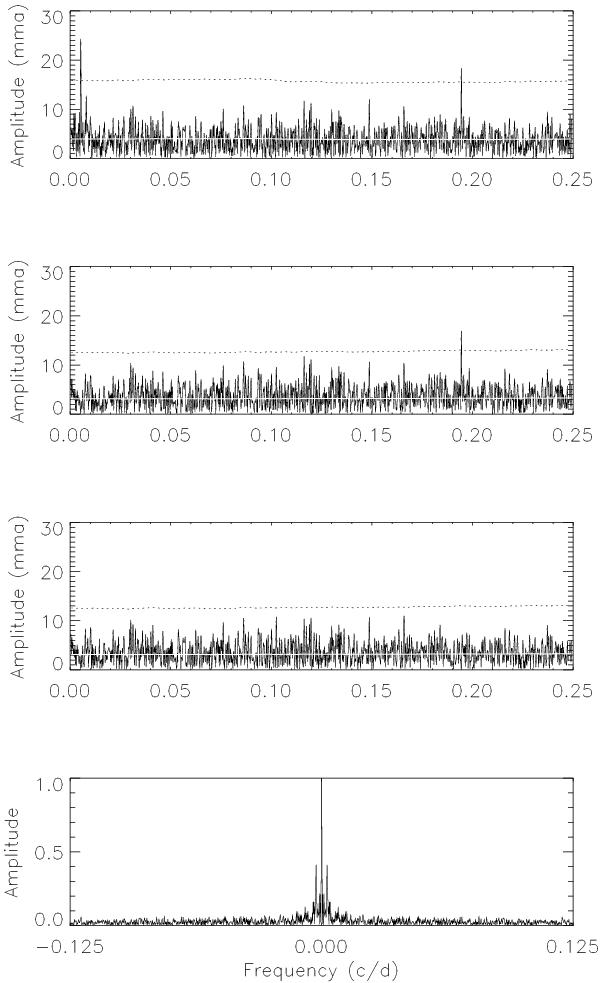
Top panel: FT of the 516 data points obtained from the (O–C) DQ Vel photometric data. Middle upper panel: FT of the residuals after prewhitening the original data by the first significant frequency (f1). Middle lower panel: FT of the residuals prewhitened by the two significant frequencies f1 and f2 listed in Table 7. The white solid line corresponds to σnoise and the dotted line corresponds to 4σnoise. Bottom panel: spectral window for the whole data set.
Current usage metrics show cumulative count of Article Views (full-text article views including HTML views, PDF and ePub downloads, according to the available data) and Abstracts Views on Vision4Press platform.
Data correspond to usage on the plateform after 2015. The current usage metrics is available 48-96 hours after online publication and is updated daily on week days.
Initial download of the metrics may take a while.