| Issue |
A&A
Volume 551, March 2013
|
|
|---|---|---|
| Article Number | A128 | |
| Number of page(s) | 9 | |
| Section | Atomic, molecular, and nuclear data | |
| DOI | https://doi.org/10.1051/0004-6361/201220870 | |
| Published online | 05 March 2013 | |
Importance of thermal reactivity for hexamethylenetetramine formation from simulated interstellar ices
1 Université Aix-Marseille, PIIM: Laboratoire de Physique des Interactions Ioniques et Moléculaires, UMR CNRS 7345, Centre de St-Jérôme, Avenue Escadrille Normandie-Niemen, 13397 Marseille, France
e-mail: This email address is being protected from spambots. You need JavaScript enabled to view it.
2 Université Paris Est Créteil (UPEC), Université Paris Diderot (UPD), LISA: Laboratoire Interuniversitaire des Systèmes Atmosphériques, UMR CNRS 7583, 61 Avenue du Général de Gaule, 94010 Créteil Cedex, France
e-mail: This email address is being protected from spambots. You need JavaScript enabled to view it.
3 Université Paris Sud, CSNSM: Centre de Spectrométrie Nucléaire et de Spectrométrie de Masse, UMR 8609 CNRS/IN2P3, bâtiment 104, 91405 Orsay Campus, France
Received: 7 December 2012
Accepted: 23 January 2013
Abstract
Context. Complex organic molecules are observed in a broad variety of astrophysical objects, but little is known about their formation mechanism. Laboratory simulations on interstellar ice analogues are therefore crucial for understanding the origin of these complex organic molecules. In this context, we focus on the thermal reactivity for the formation of the organic residue obtained after photolysis at 25 K of the interstellar ice analogue (H2O:CH3OH:NH3) warmed to 300 K.
Aims. We determine the formation mechanism of one major product detected in the organic residue: hexamethylenetetramine (HMT). We compare the warming of the photolysed interstellar ice analogue with the warming of the two non-photolysed specific ice mixtures H2CO:NH3:HCOOH and CH2NH:HCOOH, which are used as references. Using both general and specific approaches, we show the precise role of the UV photons and the thermal processing in the HMT formation.
Methods. We used Fourier transform infrared spectroscopy (FTIR) to monitor the chemical changes induced by the heating of the photolysed ice analogue and characterize some important species that will subsequently evolve in the formation of HMT in the residue.
Results. We show that the thermal processes play a key role in the HMT formation in photolysed ice analogues heated at 300 K. We identify the stable intermediates in the HMT formation that are formed during the warming: the aminomethanol (NH2CH2OH) and the protonated ion trimethyletriamine (TMTH+, C3H10N3+). We also identify for the first time a new product in the organic residue, the polymethylenimine PMI (-(CH2 -NH)n). Results from this study will be interesting for the analysis of the forthcoming Rosetta mission.
Key words: astrochemistry / ISM: molecules
© ESO, 2013
1. Introduction
Dense molecular clouds in the interstellar medium (ISM) are the sites of star formation. Within them, due to the low temperature, atoms and molecules from the gas phase condense on dust particles and form an icy mantle. In young stellar objects (YSOs) and molecular clouds, the composition of the icy mantle is dominated by H2O, while CO, CO2, CH3OH, NH3, and H2CO are also commonly observed (Gibb et al. 2001, 2004; Knez et al. 2005; Boogert et al. 2008). In these environments, the icy mantle is exposed to energetic processing such as cosmic rays, UV photons, and thermal processes that trigger the chemical evolution of the ice composition, which leads to the formation of complex molecules. This is confirmed by several astronomical observations. Organic molecules are observed in a broad variety of ISM environments and in the solar system. For example, glycolaldehyde and formamide have been detected in the gas phase of hot cores by radio astronomy. There the temperature is high enough to allow ice sublimation, releasing molecules formed within interstellar (IS) ices (Danger et al. 2012a). Carbonaceous chondrites contain carboxylic acids, aromatic hydrocarbons, alcohols, and other organic molecules (Pizzarello et al. 2006). Comets are formed by agglomeration of dust particles from an interstellar and/or solar nebula origin in the outer parts of the solar nebula. They are also rich in organic molécules. Indeed, organic molecules have been detected in cometary grains by in-situ mass spectrometry (Kissel & Krueger 1987; Fomenkova et al. 1994; Kissel et al. 2004). The delivery of these organic species to the surface of the early Earth by comets may have provided the basic ingredients required for the origin of life (Oró 1961; Bernstein et al. 2002; Muñoz Caro et al. 2002).
Laboratory experiments that simulate the energetic and thermal processing of IS ice analogues show the formation of complex organic molecules. A small fraction of new refractory species is of high molecular mass, up to 4000 amu at room temperature (Danger et al. 2012b), this material is generally called refractory organic residue, or simply residue. Large organic compounds are produced either by ice photoprocessing (Agarwal et al. 1985; Briggs et al. 1992; Bernstein et al. 1995; Muñoz Caro & Schutte 2003; Muñoz Caro et al. 2004), by ion bombardment (Cottin et al. 2001; Strazzulla & Baratta 1992; Kobayashi et al. 1995; Kaiser & Roessler 1998), or by thermal processes (Bossa et al. 2009; Vinogradoff et al. 2011; Danger et al. 2011; Vinogradoff et al. 2013, 2012a).
Among the complex organic molecules that have been detected in this organic residue produced in the laboratory, hexamethylenetetramine (HMT, C6H12N4, Fig. 1) has been observed by numerous authors (Bernstein et al. 1995; Muñoz Caro & Schutte 2003; Muñoz Caro et al. 2004; Cottin et al. 2001). It can reach up to 50% of residue mass. This molecule seems to be of prime interest because its acid hydrolysis forms ammonia, formaldehyde, and amino-acids (Hulett et al. 1971). Thus, HMT may be a significant source of prebiotic compounds on the early Earth. HMT was proposed as a good tracer of photochemical processing in the pre-cometary phase (Bernstein et al. 1995) because it is supposed to be formed through the photolysis of the IS ice. However, it has already been shown that HMT could be formed after proton irradiation of H2O:CO:CH3OH:NH3 ices (Cottin et al. 2001), or by only heating at room temperature, without any energetic processing (photons or particles), of H2CO:NH3:HCOOH ices (Vinogradoff et al. 2011, 2012b). Furthermore, Vinogradoff et al. (2011, 2012b) suggested that HMT formation could not be explained only by UV photolysis processes, but rather by UV and thermal activations from canonical H2O:CO:CH3OH:NH3 ice mixture. Indeed, HMT would be an indicator of thermal processed ice rather than a photochemically processed one because of its formation mechanism.
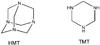 |
Fig. 1 Structures of HMT (hexamethylenetetramine C6H12N4) and TMT (trimethylenetriamine C3H9N3). |
The classical experimental approach in laboratory studies mainly focuses on residue composition (Bernstein et al. 1995; Muñoz Caro et al. 2004) but rarely on the chemistry induced during the reaction between 10 K and room temperature. The aim of this work is to understand the chemical changes during the warming of the photolysed ice mixture and especially the HMT formation, using two non-photolysed specific ice mixtures as comparative references. The idea is not to fully identify all species that are produced during the warming, but rather to focus on processes and intermediates that are crucial in the HMT formation from a H2O:CH3OH:NH3 ice mixture. The molecular ratios we used here, between methanol and ammonia, are consistent with IS and cometary ice composition. H2O is the main oxygen-bearing component, NH3 is the main nitrogen-bearing component (around 10% with respect to water) and CH3OH the most abundant organic molecule containing carbon, hydrogen, and oxygen (around 10% with respect to water) (Gibb et al. 2001, 2004; Knez et al. 2005; Boogert et al. 2008). We chose to exclude another important molecule, carbon dioxyde (CO2), to simplify the analysis. Indeed, carbon dioxyde is known to thermally react in interstellar ice analogues with ammonia, forming carbamate (Bossa et al. 2008; Bertin et al. 2009).
In this study, we monitor the chemical changes induced by the heating of the photolysed ice and characterise some important species that subsequently evolve into the residue containing HMT. For the first time, we identify in a photolysed ice mixture, the major stable intermediates that lead to the formation of HMT at room temperature: the aminomethanol molecule (NH2CH2OH) and the protonated ion of trimethylenetriamine (TMTH+, C3H10N ) (see Fig. 1). We compare the thermal evolution after the photolysis of H2O:CH3OH:NH3 ice mixtures (EXP1) with the warming of two non-photolysed specific ice mixtures H2CO:NH3:HCOOH (EXP2) and CH2NH:HCOOH (EXP3), used as references (Vinogradoff et al. 2011, 2012b). Using both general and specific approaches, we show the precise role of the UV photons and the thermal processing in the HMT formation.
2. Experimental
To study the thermal evolution after the photolysis of an H2O:CH3OH:NH3 ice mixture (EXP1), an experimental device similar to the one described in Allamandola et al. (1988), which was previously described in Le Roy et al. (2012), was used. A CsI window was cooled down to 25 K with a closed-cycle helium cryostat (Advanced Research Systems, Inc.). Its temperature, measured with two thermocouples (type E and Au-Fe-Cr), is adjustable by means of a resistive heater driven with a temperature controller (Lakeshore). This window is located inside a high-vacuum stainless steel chamber evacuated at about 10-8 mbar. In this device the infrared beam, for the analysis of the solid thin film, and the VUV beam for the photolysis are perpendicular to each other, and the CsI window is oriented at 45° of each beam, allowing simultaneous photolysis and analysis. Basically, gas mixtures can be injected to the vacuum chamber to be condensed on the CsI window cooled to 25 K and be simultaneously photolysed. The mixtures are prepared by filling two bulbs while their partial pressures are monitored.
The gas mixtures prepared for our experiments contain H2O triply distilled, CH3OH from Sigma-Aldrich 99.9% and NH3 from Air Liquid 99.995%. In the first bulb, we prepared the H2O:CH3OH mixture in 10:1 proportions, which were then injected into the vacuum chamber to form ices with a condensation rate at about 1015 molecules cm-2 s-1. The second bulb was filled only with ammonia. This was injected at the same time as the H2O:CH3OH mixture with a condensation rate of about 1014 molecules cm-2 s-1, resulting in an ice mixture of H2O:CH3OH:NH3 in 10:1:1 proportions. The condensation rates were calibrated according to preliminary experiments. The VUV photolysis was performed at the same time as the injection with a microwave-powered hydrogen-flow discharge lamp. This lamp was equipped with an MgF2 window. The typical emission spectrum of this type of lamp is composed of the Lyman-α line of atomic hydrogen at 121.6 nm and of a broad emission band centred at about 160 nm generated by molecular hydrogen. Preliminary chemical actinometry experiments, performed with the protocol provided by Cottin et al. (2003), allowed us to measure a flux of about 1014 photons cm-2 s-1 in our experimental setup. Thus, in this experiment we have a photon-to-molecule ratio of about 0.1. Each injection lasted approximately nine hours. After that time, injection and photolysis were stopped. Then, the two bulbs were refilled to prepared a new injection. This procedure was repeated six times to achieve an injection and photolysis time of 56 hours. After the photolysis, the ice mixture was warmed to 175 K, the heating rate being 2 K/min. Afterwards, to obtain a gentle ice sublimation, the heating rate was changed to 0.4 K/min, until the temperature reached 300 K. The infrared spectra were measured simultaneously to the warming and each spectrum was averaged on 256 scans between 4000 and 600 cm-1.
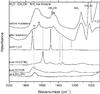 |
Fig. 2 Infrared spectra between 900 and 2000 cm-1 of the EXP1 ice mixture (H2O:CH3OH:NH3=10:1:1). The spectrum before irradiation was measured after 10 min of ice deposition at 25 K without photolysis. Afterwards, we started the simultaneous ice deposition and photolysis for 56h at 25 K. The two spectra are compared with pure ice of H2CO, NH |

For the two specific ice mixtures (EXP2 and EXP3), the experimental device is precisely described in Vinogradoff et al. (2012b). EXP2 is composed of H2CO (heating of paraformaldehyde from Aldrich) NH3 (99.9995% pure gas from Air Liquide) and HCOOH (from Acros Organics, 99% purity) molecules, the EXP3 mixtures contain CH2NH (synthesized in the laboratory) and HCOOH molecules. The ice mixtures are deposited at 25 K and then warmed with a 4 K min-1 temperature rate up to 330 K with a temperature controller. Pure HMT was bought from Aldrich to register a pure HMT infrared spectrum and PMI (polymetheleneimine) was formed in situ in the ice mixture by sublimation of HMT (produced by the experiments) at 400 K, because PMI is more refractory, see Vinogradoff et al. (2012b).
3. Results and discussion
3.1. Photolysis of an interstellar/cometary ice mixture: H2O:CH3OH:NH3 (EXP1)
Figure 2 shows infrared spectra of the EXP1 ice mixture composed of H2O:CH3OH:NH3 = 10:1:1. The first spectrum was recorded after 10 min of ice deposition without irradiation at 25 K, while the second spectrum was measured after deposition and photolysis during 56 h at 25 K. We assigned most of the bands that are observed after photolysis at 25 K (Table 1). Two products can be securely assigned, formaldehyde, H2CO, at 1723, 1502, and 1246 cm-1 (Schutte et al. 1993), and formate ion, HCOO−, at 1585, 1378, and 1353 cm-1 (Schutte et al. 1999). No cations were securely attributed, nevertheless, ammonium ions (NH ) are expected to be present and be the counter ion of HCOO−, and could contribute to the structure at 1460 cm-1. Indeed, it has been shown previously that at low temperature, the features of the formate ion are clearly observable, whereas those of NH are too weak to be clearly discernible (Gálvez et al. 2010). An individual spectrum of each product is displayed in Fig. 2 for comparison. The formation of these compounds can be explained by the photo-dissociation of CH3OH and H2O and recombination of photoproducts. The photolysis of pure methanol at low temperature has been previously investigated by Öberg et al. (2009). They reported three photodissociation channels: CH2OH+H, OCH3 +H, and CH3+OH with a photodissociation branching ratio of 5:1: < 1:
 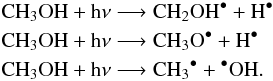 Subsequent photolysis and bond breaking form the formaldehyde, the HCO radical, and finally the carbon monoxyde:
 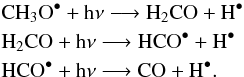 Ammonium formate is formed through low-temperature reaction of HCOOH and NH3 (Schutte et al. 1999):

Although detecting of the formate ion is an indirect evidence of HCOOH formation, the bands of HCOOH cannot be unambiguously identified because they overlap with bands of formaldehyde, ammonia, and water in the 1800–1600 cm-1 region. Several solid-phase reaction channels have been proposed in the past decades to explain HCOOH formation from atomic recombinations (Tielens & Hagen 1982; Garrod & Herbst 2006). An alternative formation route has been experimentally proposed by Ioppolo et al. (2011). They observed the formation of HCOOH at low temperature mainly through hydrogenation of the HO-CO complex:
![Mathematical equation: $$\rm CO + {}^\bullet OH \longrightarrow HO\text{-}CO\xrightarrow[\text{}]{\text{H}} HCOOH.$$](/articles/aa/full_html/2013/03/aa20870-12/aa20870-12-eq54.png)
This way to form HCOOH is the most likely here due to H2O photolysis in the EXP1 experiment, and could explain why CO is not detected in our ice mixture. Another way to form HCOOH in solid phase has been shown by Hudson & Moore (1999), which invokes recombination of OH, produced by the photolysis of water, and HCO, coming from methanol via formaldehyde photolysis:

In the 1800–1600 cm-1 range we also observed bands of formamide NH2CHO produced by the photolysis of ammonia and HCO• radicals, leading to the contribution of the bands at 1710 cm-1.
Assigned features of the infrared spectrum of the EXP1 ice mixture H2O:CH3OH:NH3: = 10:1:1 after 56 h of VUV photolysis at 25 K.
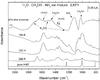 |
Fig. 3 Infrared spectra of the EXP1 ice mixture (H2O:CH3OH:NH3 = 10:1:1) photolysed at 25 K (56h) followed by a warming at 180 K, 260 K, and 300 K, compared with pure HMT at 300 K. |
The ice mixture was then warmed and monitored by FTIR spectroscopy. After the H2O, CH3OH, and NH3 sublimation, the infrared spectrum and the chemical composition of the ice mixture are greatly changed (Fig. 3), indicating that chemistry is occurring during the warming. At 180 K, we observe two strong bands, located at 1573 and 1002 cm-1 (Table 2). This could be associated to C-O/C-N stretching modes, while the band at 1573 cm-1 is assigned to the (COO−) antisymmetric stretching mode of the formate ion HCOO−. At 260 K the band at 1002 cm-1 disappears, leaving new products with bands at 1068, 1341, 1376, and 1580 cm-1 (Table 3). As the thermal processing continues, the most volatile compounds sublimate and leave at 300 K an organic residue characterised by a complex infrared spectrum. Nevertheless, some bands in the EXP1 residue agree well with characteristic bands of HMT (C6H12N4), at 812, 1006, 1235, 1366, and 1462 cm-1 (Bernstein et al. 1994). This is not surprising because HMT is known to be one of the main components of organic residues formed from a canonical IS ice analogue (composed of H2O:CH3OH:NH3:CO:CO2) photolysed at low temperature and warmed to room temperature (Bernstein et al. 1995; Schutte 2002; Bernstein et al. 1997; Cottin et al. 2001; Muñoz Caro & Schutte 2003; Muñoz Caro et al. 2004). Knowing that the warming of the different molecules of the ice mixture CH3OH:NH3 / H2O sublime without any reaction, we deduce that the photolysis products are the precursors of HMT. In the following section we show each step of the formation of the intermediates needed for the HMT production during the warming of the photolysed IS ice analogue.
3.2. HMT precursor identification
3.2.1. Formation of HMT from the precursors by thermal processes: dedicated experiments EXP2, and EXP3
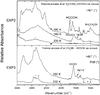 |
Fig. 4 Infrared spectra of the EXP2 ice mixture (H2CO:NH3:HCOOH) warmed at 180, 260, and 330 K and the EXP3 ice mixture (CH2NH:HCOOH) warmed at 260 and 330 K, no photolysis. |
HMT can be synthesised by thermal processes if specific ice compositions are selected (Vinogradoff et al. 2011). The reactant molecules were chosen on the basis of the molecules formed after the photolysis of the H2O:CH3OH:NH3 ice mixture described above (Table 1). We report in Fig. 4 the thermal evolution of the two dedicated experiments.
The first dedicated experiment (EXP2) is the heating of an H2CO:NH3:HCOOH ice mixture (Fig. 4). After warming at 180 K, the formation of aminomethanol (NH2CH2OH) and formate ion (HCOO−) is observed. The aminomethanol is formed from the nucleophilic addition reaction of ammonia and formaldehyde (Bossa et al. 2009), and is detected in two bands at 1002 and 3366 cm-1. The formate ion is formed via acid-base reaction between formic acid (HCOOH) and ammonia. Then, the methylenimine (CH2NH) should be formed through a dehydration process of the aminomethanol in the presence of HCOOH (Vinogradoff et al. 2012b). Unfortunately, this latter intermediate is never observed due to its high reactivity, but instead polymerises, giving a new intermediate: the cyclic trimer of CH2NH, the trimethylenetriamine (TMT, C3H9N3, Fig. 1), the first cycle of HMT structure, in its protonated form TMTH+ (Vinogradoff et al. 2012b). Indeed, at 260 K, almost pure TMTH+HCOO− species stay on the substrate since the volatile compounds have desorbed (see Fig. 4). Finally, at 330 K TMTH+HCOO− is converted into HMT.
Assigned features of the infrared spectrum of the EXP1 ice mixture H2O:CH3OH:NH3 = 10:1:1 after 56 h of VUV photolysis at 25 K and warmed at 180 K.
Assigned features of the infrared spectrum of the EXP1 ice mixture (H2O:CH3OH:NH3 = 10:1:1) after 56 h of VUV photolysis at 25 K and warmed at 260 K.
The first dedicated experiment (EXP2) points out the expected presence of methylenimine as a chemical intermediate. To confirm this hypothesis, a second dedicated experiment (EXP3) dealt with this expected intermediate: the heating of a CH2NH:HCOOH ice mixture. At 260 K, as for the first experiment, after the warming we observed TMTH+HCOO− salt. At 330 K, we observed not only the features of HMT but also another product, the PMI, polymethylenimine polymer (Fig. 4). PMI is a polymer identified by Danger et al. (2011) and Vinogradoff et al. (2012b) in ice mixtures containing methylenimine, CH2NH. Interestingly, the pure imine (CH2NH) does not lead to HMT in the interstellar-like conditions (Vinogradoff et al. 2012b) and has to be catalysed by the formic acid. Thus HCOOH plays a double catalytic role in HMT formation, (i) for the dehydration of aminomethanol, and (ii) for the cyclisation until HMT (Vinogradoff et al. 2011, 2012b).
3.2.2. Warming the EXP1 ice mixture at 180 K: identification of NH2CH2OH
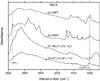 |
Fig. 5 Infrared spectra of: a) EXP1 ice mixture (H2O:CH3OH:NH3= 10:1:1) after photolysis and warmed at 180 K, b) EXP2 ice mixture (H2CO:NH3:HCOOH) warmed at 180 K, compared with infrared spectrum of NH2CH2OH formed from warming of the H2CO:NH3:H2O ice mixture at c) 180 K and d) 190 K (with some residual water). |
Four spectra are shown in Fig. 5: a) the photolysed ice mixture (EXP1) warmed at 180 K; b) the first specific ice mixture H2CO:NH3:HCOOH (EXP2) warmed at 180 K; c) NH3:H2CO:H2O ice mixture warmed at 180 K, and d) NH3:H2CO:H2O ice mixture warmed at 190 K. Spectra c) and d) in Fig. 5 refer to the aminomethanol formation from the warming of NH3:H2CO:H2O ice mixture, according to the procedure described by Bossa et al. (2009), before and after water sublimation. These two spectra are considered as reference spectra of aminomethanol below. They show that the ice environment has a significant influence on the aminomethanol infrared spectrum. Indeed, the two characteristic bands of aminomethanol located around 3366 and 1002 cm-1 are significantly broader in water environment than in the pure solid (Fig. 5c,d). Both these features at 1002 cm-1 and 3366 cm-1 are clearly defined in the spectra of EXP1 and EXP2 (see Fig. 5, Table 2), showing that the warming process of the different ice mixtures leads to the aminomethanol formation.
It is worth mentioning that both EXP1 and EXP2 do contain other products. In the photolysed ice mixture (EXP1) spectrum (Fig. 5a), we observe a strong band at 1573 cm-1 corresponding to the HCOO− ion (Schutte et al. 1999) as well as a feature at 1686 cm-1, which could be tentatively assigned to a carboxylic acid (perhaps to formic acid (HCOOH) – Table 2). This ion could be associated with  , which is consistent with the broad band at 1454 cm-1 (Table 2). The warming of the photolysed ice mixture (EXP1) has enabled the aminomethanol formation through the thermal reaction between formaldehyde generated during the UV photolysis and ammonia. NH2CH2OH is the first intermediate in the HMT mechanism (Vinogradoff et al. 2011), and as mentioned above, since HCOOH is also tentivately detected at 180 K, a road toward HMT is opened.
 ![Mathematical equation: \begin{eqnarray*} \rm \left. \begin{array}{lll} \rm CH_3OH \\ \rm NH_3 \\ \rm H_2O \end{array} \right\} \rm \xrightarrow{\text{h}\nu} H_2CO+HCOOH+NH_3 \xrightarrow[\text{}]{T>70~K} NH_2CH_2OH.\\ \end{eqnarray*}](/articles/aa/full_html/2013/03/aa20870-12/aa20870-12-eq85.png)
3.2.3. Warming the EXP1 ice mixture at 260 K: identification of the TMTH+ ion
As the temperature is increased from 180 K to 260 K, the infrared spectrum of the photolysed ice mixture (EXP1) is greatly modified, indicating changes in the ice composition due to both sublimation of volatiles and reactivity induced by thermal activation. Between 180 and 260 K, the aminomethanol features disappear. The features of the formate ion, detected at lowest temperatures, are still clearly observed although they have slightly shifted. This shift could be due in part to the warming but it is mainly assigned to a change of the counter ion of HCOO−. Indeed, the nature of the new counter ion has been revealed using quantum calculation (Vinogradoff et al. 2012b).
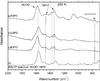 |
Fig. 6 Infrared spectra of the three mixtures at 260 K, between 2000−700 cm-1: a) EXP1 (H2O:CH3OH:NH3) ice mixture after photolysis and warmed at 260 K, b) H2CO:NH3:HCOOH ice mixture only warmed at 260 K, and c) CH2NH:HCOOH ice mixture only warmed at 260 K, compared with the B3LYP spectrum of HCOO−TMTH+ salt (from Vinogradoff et al. 2012b). |
In Fig. 6d, the calculated infrared spectrum of the TMTH+HCOO− is shown. The TMTH+HCOO− infrared spectrum is dominated by strong bands located at 1580, 1464, 1376, 1341, and 766 cm-1 (Fig. 6, Table 3). These bands are clearly seen in the spectrum of the photolysed ice mixture (EXP1) recorded at 260 K attesting the TMTH+ formation during the warming of the photolysed ice mixture. The attribution of the 1464 cm-1 band to the TMTH+ is consolidated by the observation of the same band in the infrared spectra recorded at 260 K after the warming of the HCOOH:CH2NH ice mixture (EXP3). Furthermore, TMTH+ is also detected in the spectrum at 260 K of the first dedicated experiment (EXP2), starting with an H2CO:NH3:HCOOH ice mixture. Because we already detected NH2CH2OH in these experiments, it shows that CH2NH comes from the dehydration of NH2CH2OH by HCOOH. This dehydration was verified using mass spectrometry (see Vinogradoff et al. 2012b, for details). Some additional bands are observed in the photolysed EXP1 ice mixture, at 964, 1068, and 1215 cm-1 and are certainly due to other products in ice mixture (Table 3). NH2CH2OH> [CH2NH]→TMTH+HCOO− + ?
3.2.4. HMT formation at 300 K and comparison between the three residues
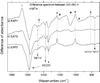 |
Fig. 7 Infrared spectra of the difference 300 K (presented in Fig. 8) minus 260 K (presented in Fig. 6) (1/1), a) H2O:CH3OH:NH3 ice mixture, b) H2CO:NH3:HCOOH ice mixture, and c) CH2NH:HCOOH ice mixture. # and ξ refer to unknown compounds in the EXP1 ice mixture, photolysed and warmed. |
Assigned features of the infrared spectrum of the EXP1 ice mixture (H2O:CH3OH:NH3 = 10:1:1) after 56 h of VUV photolysis at 25 K and warmed at 300 K.
The thermal evolutions between 260 K and 300 K (or 330 K) of the three ice mixtures (EXP1, EXP2, and EXP3) are reported in Fig. 7. The difference spectra were obtained by subtracting spectra recorded at 300 K (EXP1) or 330 K (EXP2 and EXP3) and the one at 260 K, with a 1/1 ratio. In Fig. 7, spectrum a) refers to the photolysed ice mixture (H2O:CH3OH:NH3), spectra b) and c) refer to the two specific ice mixtures H2CO:NH3:HCOOH and CH2NH:HCOOH. The negative bands attest to the loss of the compounds (by chemical reaction or their sublimation), while the positive bands attest to the formation of new compounds that occur in this temperature range. The positive bands observed at 812, 1006, 1235, and 1462 cm-1 are due to the HMT formation (dotted line) while negative bands at 1580, 1464, 1376, 1341, and 766 cm-1 indicate the disappearance of TMTH+HCOO− between 260 K and 300 K (Fig. 7a, dashed line).
The infrared spectrum of the organic residue remaining at 300 K, after the photolysis and the warning of the ice, is very complex and its evolution between 260 and 300 K is not fully understood. As an example, an unknown product with a feature at 1670 cm-1 appeared while at least one molecule with bands at 950, 1050 and 1210 cm-1 disappeared. However, the thermal evolution between 260 K and 300 K of the three experiments presented here follows the same trend: HMT formation and the decrease of the TMTH+HCOO− species. This observation shows that HMT is synthetised from TMTH+ and the chemistry leading to HMT in this three experiments is identical: TMTH+HCOO− T>290 HMT(s) + HCOOH (g). The HCOOH release has been verified by mass spectrometry for EXP2 and EXP3 (see Vinogradoff et al. 2012b).
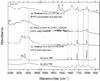 |
Fig. 8 Infrared spectra of three residues at 300 K, a) from H2O:CH3OH:NH3 ice mixture photolysed at 25 K and warmed until 300 K, b) from H2CO:NH3:HCOOH ice mixture only warmed until 330 K, and c) from CH2NH:HCOOH ice mixture only warmed until 330 K, compared with d) pure HMT in the same experimental conditions at 260 K, and e) pure PMI in the same experimental conditions at 500 K. κ sign to remaining HCOO− in the ice mixture. |
We report in Fig. 8 the infrared spectra of the three organic residues at room temperature. In this figure, the first residue (a) is formed from the photolysed ice mixture. The second (b) and the third one (c) are obtained from the heating of the specific ice mixtures, H2CO:NH3:HCOOH and CH2NH:HCOOH. These residues are compared to pure HMT (d) and pure PMI (e) in the same experimental conditions. Infrared bands as well as vibrational assignments of the residue produced from the photolysed and subsequent warming of the EXP1 ice mixture are reported in Table 4. In the spectrum of this residue, we unambiguously observed the characteristic bands of HMT (dotted lines) located at 812, 1006, 1235, 1366, 1462, and 2872 cm-1 (Bernstein et al. 1994). We can say without doubt that a part of this organic residue is composed of HMT. Moreover, the broad bands at 970, 1091, and 1209 cm-1 can be assigned to PMI. Because PMI is a polymer of CH2NH (inevitable molecule in the HMT formation), it is not surprising to observe it. We also observed two bands at 1592 and 779 cm-1 (Fig. 8a) that might be assigned to the remaining formate ion (κ sign) trapped in the ice mixture. Unfortunately, we cannot attribute the band at 1670 cm-1 to a specific molecule; it could be due to amides, carboxylic acid, or carbamate, see Bossa et al. (2008). We can note that a similar band has already been observed by Bernstein et al. (1995).
Despite the different starting material and different energetic processing, the warming of the photolysed ice mixture leads to HMT and PMI as well as to the two dedicated experiments in which H2CO:NH3:HCOOH and CH2NH:HCOOH ice mixtures are only warmed (see Fig. 8). It has to be noted that pure HMT sublimates in our experimental conditions at around 260 K, while the HMT observed in the three residues is still present at 300 K. The formation of highly refractory compounds such as PMI trap the HMT in a complex refractory matrix that delays the sublimation of HMT.
3.3. Discussion
Laboratory experiments simulating the energetic and thermal processing of interstellar ice analogues are crucial for understanding the chemical evolution of materials from the ISM to planetary systems. In this work, an H2O:CH3OH:NH3 10:1:1 ice mixture was submitted to VUV photons and was subsequently warmed, with the intention to simulate the interstellar ice evolution. Such processes could happen for the IS ice during the collapse and formation of proto-stellar cores or in the solar system. When warmed to room temperature, the photolysed IS ice analogues produces an organic residue, which is assumed to be a close analogue of organic compounds present in comets.
The thermal processes are often neglected but they affect the bulk and the surface composition of ice, although UV photons affect only the surface composition.
In this study, we chose to focus on the chemical mechanisms induced by thermal processes that lead to the formation of only one precise molecule, unambiguously detected in these residues: HMT. To understand the chemical evolution induced by the warming, we used two dedicated experiments in which ice mixtures were only warmed, leading to a simpler chemical evolution than in the photolysis experiment. These two dedicated experiments started with a deposit of H2CO:NH3:HCOOH and CH2NH:HCOOH ice mixtures at low temperature. With these dedicated experiments, we showed that two intermediates, aminomethanol (NH2CH2OH) and TMTH+ (protonated form of the trimethylenetriamine, C3H10N3), are formed during the warming of the photolysed ice analogue. HMT is only formed at about 280–290 K from the last stable intermediate, the TMTH+. The neutral form of this intermediate was postulaled by Bernstein but was never characterised due to the lack of spectroscopic data. Moreover, the decrease of a band at about 1460 cm-1 correlated with the appearance of the HMT at room temperature was previously observed by Muñoz Caro & Schutte (2003); unfortunately, because the infrared spectrum of the TMTH+ ion was not known at that time, they misattributed this band to the ammonium ion .
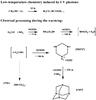 |
Fig. 9 Mechanism of HMT formation induced by UV photons and thermal activation from interstellar ice analogues. |
The mechanism of HMT formation is presented in Fig. 9 and has been split into two parts: the first part corresponds to the H2CO and HCOOH production from CH3OH and H2O photolysis and occurs only at low temperature, while the second part is purely activated by the warming from 25 K to 300 K. Interestingly, the mechanism presented here is not so different from the one reported by Bernstein et al. (1995), based on the HMT formation in liquid phase.
The first difference comes from the presence of formic acid, which acts as a catalyst and stabilizer for two important steps. For T > 180 K, HCOOH allows the polymerisation of methylenimine, and then the formation of the salt TMTH+HCOO−, which maintain the molecule (TMT) needed at higher temperature to form HMT. The second main difference is the final cyclisation of TMT to form HMT. Bernstein et al. (1995) proposed, based on the mechanism in liquid phase, that additional reactions of TMT with formaldehyde and/or ammonia would lead to HMT just after the irradiation process at around 50 K. However, we showed that TMT is formed at around 180 K in laboratory conditions, a temperature at which both formaldehyde and ammonia have already sublimated. Instead, theoretical calculations show that the final cyclisation of HMT is the reaction between TMT and its decomposition products (precise mechanism can be found in Vinogradoff et al. 2012b) at only 290 K in laboratory conditions.
Moreover, Bernstein et al. (1995) mentioned that the reaction needs to be activated by UV photons because of the high activation barriers required to form HMT. But, the activation barriers are significantly reduced by the action of HCOOH, which acts as a catalyst that allows the reaction to proceed to the solid state (Fig. 10). Consequently, photons are only crucial to form formaldehyde and formic acid from methanol, and HMT is thermally formed from the right reactants, namely formaldehyde, ammonia, and formic acid, as shown by the EXP2.
In addition, we demonstrated that the residue also contains a polymer of methylenimine (PMI) that was previously postulated by Bernstein et al. (1995) but was never characterised experimentally due to the lack of spectroscopic data on this polymer at that time.
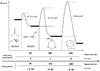 |
Fig. 10 Summary of HMT formation: representation of the activation barriers for the different intermediates (calculated with B3LYP/6-31G** and adapted from Vinogradoff et al. 2012b) with the corresponding temperature and time (τ) to form the intermediates in laboratory experiments. The extrapolation temperature and time were calculated by an Arrhenius law. |
Hence, we showed the importance of studying only one energetic process at a time (photons or temperature) if we aim to fully understand the nature of the residue as well as the chemical processes that drive its formation. This study showed that HMT is no direct product of the photolysis but that its formation requires a warming at about 280 K (in laboratory conditions) because of the presence of a high activation barrier during the last step of the HMT synthesis (Fig. 10).
While HMT has already been detected in organic residue produced in laboratory for a long time, it has never been observed in astrophysical objects so far. We showed that HMT is synthesised only at a relatively high temperature: about 280 K in laboratory conditions in less than one day. In the interstellar medium, where reactions can occur on a much longer time scale, one might conclude that HMT could be formed at a lower temperature. Accordingly, we roughly extrapolated our results so that they match the ISM time scale (Fig. 10). We extrapolated our experimental laboratory conditions with an Arrhenius law, as shown in Fig. 10, by taking  with Ea the activation energy, R the universal gas constant, T1 the laboratory temperature, T2 the extrapolation temperature, and τ the time of formation. From the activation barriers for each intermediate, we are able to calculate an approximate formation time for each molecule as a function of temperature. The different temperatures were chosen to represent different interstellar objects, such as molecular clouds (around 20 K), proto-stellar environment (around 130 K), and proto-planetary disk or comets/asteroids in the inner solar-system environment for 200 K. In these conditions we estimate that HMT could be formed after 5 × 10⁴ years at 200 K and that TMTH+ could be found in colder (130 K) interstellar objects after 6 × 10³ years. This extrapolation intends to give an idea about the formation kinetics in the ISM for HMT and its precursors if we exclude the presence of other molecules and/or other energetic processes and/or desorption processes in the grains. Nonetheless, the Fig. 10 extrapolation shows that HMT could be detected in objects that have been submitted to thermal processing but not necessarily at temperatures as high as in our experiments.
Moreover, because HMT is transformed into amino acids through acid hydrolysis during an extraction process (Hulett et al. 1971), it could not be detected in meteoritic sample. Therefore, several reasons can be proposed to explain the present non-detection of HMT in astrophysical objects, first because of the specific conditions of its formation mechanism and second because of the aqueous and thermal alteration on the meteorite parent bodies that transform HMT into amino acids.
Furthermore, results from this study will be interesting for the analysis of the forthcoming Rosetta mission, which will perform in-situ analyses of the comet 67P/Churyumov-Gerasimenko. We showed that the HMT formation proceeds from several intermediates and that their domain of thermodynamical stability differs from one to the other. Thus, all these compounds, i.e. HMT, TMT, methylenimine, and aminomethanol, have to be searched for. At the nucleus surface, these compounds may be detected with the COSAC instrument (a gas chromatograph coupled with a time-of-flight mass spectrometer) onboard the Philae lander. In the cometary environment, HMT and its precursors can be searched for by mass spectrometry in solid as well as in gas phase with the COSIMA and ROSINA instruments, respectively. A detection of HMT or of one of its precursor in comet 67P/C-G could be used as a probe to estimate the maximal temperature range reached by cometary matter.
4. Conclusion
We showed that thermal processes play a key role in the HMT formation in photolysed ice analogues heated at 300 K. Using general and dedicated approaches, we showed the precise role of the UV photons and the thermal processing in the HMT formation. At low temperature UV photons are necessary for the formation of formaldehyde (H2CO) and formic acid (HCOOH). Subsequent warming allows the reaction between formaldehyde and ammonia to produce aminomethanol (NH2CH2OH), which is the first intermediate towards the HMT synthesis. Then methylenimine (CH2NH) is formed through the dehydration of aminomethanol catalysed by formic acid. Additional warming enables the conversion of methylenimine into TMT and then HMT. This chemical mechanism was revealed with a dedicated experiment in which the reactants were carefully chosen to clarify the different steps of this mechanism. It showed that HMT formation occurs after warming at about 280 K and not as a direct photolysis product. Thus, we predict that HMT may be present only in astrophysical media that have been thermally processed. We also identified for the first time a new product in the organic residue, the PMI (-(CH2 - NH)n-). Results from this study will be interesting for the analysis of the forthcoming Rosetta mission. We underline that HMT as well as its precursors have to be searched for by in-situ analyses in solid and gas phases in the cometary environment and nucleus. The detection of one or several of these compounds could give constraints on the maximum temperature as well as time heating reached by the organic matter that is to be analysed.
Acknowledgments
We acknowledge the CNES (Centre national des études spatiales), INSU (Institut national des Sciences de l’Univers) EPOV (Environnement planétaire et origines de la vie) and PCMI (Physique Chimie du Milieu Interstellaire) French programs for their financial support. This work has also been funded by the Provence Alpes Côtes d’Azur (PACA) region.
References
- Agarwal, V., Schutte, W., Greenberg, J., et al. 1985, Origins of Life and Evolution of Biospheres, 16, 21 [Google Scholar]
- Allamandola, L., Sandford, S., & Valero, G. 1988, Icarus, 76, 225 [NASA ADS] [CrossRef] [Google Scholar]
- Bernstein, M., Sandford, S., Allamandola, L., & Chang, S. 1994, J. Phys. Chem., 98, 12206 [NASA ADS] [CrossRef] [Google Scholar]
- Bernstein, M., Allamandola, L., & Sandford, S. 1997, Adv. Space Res., 19, 991 [NASA ADS] [CrossRef] [PubMed] [Google Scholar]
- Bernstein, M., Dworkin, J., Sandford, S., et al. 2002, Nature, 416, 401 [NASA ADS] [CrossRef] [PubMed] [Google Scholar]
- Bernstein, M., Sandford, S., Allamandola, L., Chang, S., & Scharberg, M. 1995, ApJ, 454, 327 [NASA ADS] [CrossRef] [Google Scholar]
- Bertin, M., Martin, I., Duvernay, F., et al. 2009, Phys. Chem. Chem. Phys., 11, 1838 [CrossRef] [Google Scholar]
- Boogert, A., Pontoppidan, K., Knez, C., et al. 2008, ApJ, 678, 985 [NASA ADS] [CrossRef] [Google Scholar]
- Bossa, J., Theulé, P., Duvernay, F., Borget, F., & Chiavassa, T. 2008, A&A, 492, 719 [NASA ADS] [CrossRef] [EDP Sciences] [Google Scholar]
- Bossa, J., Theule, P., Duvernay, F., & Chiavassa, T. 2009, ApJ, 707, 1524 [NASA ADS] [CrossRef] [Google Scholar]
- Briggs, R., Ertem, G., Ferris, J., et al. 1992, Origins of Life and Evolution of Biospheres, 22, 287 [Google Scholar]
- Brucato, J., Baratta, G., & Strazzulla, G. 2006, A&A, 455, 395 [NASA ADS] [CrossRef] [EDP Sciences] [Google Scholar]
- Cottin, H., Szopa, C., & Moore, M. 2001, ApJ, 561, L139 [NASA ADS] [CrossRef] [Google Scholar]
- Cottin, H., Moore, M., & Bénilan, Y. 2003, ApJ, 590, 874 [NASA ADS] [CrossRef] [Google Scholar]
- Danger, G., Borget, F., Chomat, M., et al. 2011, A&A, 535, A47 [NASA ADS] [CrossRef] [EDP Sciences] [Google Scholar]
- Danger, G., Duvernay, F., Theulé, P., Borget, F., & Chiavassa, T. 2012a, ApJ, 756, 11 [NASA ADS] [CrossRef] [Google Scholar]
- Danger, G., Orthous-Daunay, F.-R., de Marcellus, P., et al. 2012b, Geochim. Cosmochim. Acta, submitted [Google Scholar]
- Fomenkova, M., Chang, S., & Mukhin, L. 1994, Geochim. Cosmochim. Acta, 58, 4503 [NASA ADS] [CrossRef] [Google Scholar]
- Gálvez, O., Maté, B., Herrero, V., & Escribano, R. 2010, ApJ, 724, 539 [NASA ADS] [CrossRef] [Google Scholar]
- Garrod, R., & Herbst, E. 2006, A&A, 457, 927 [NASA ADS] [CrossRef] [EDP Sciences] [Google Scholar]
- Gibb, E., Whittet, D., & Chiar, J. 2001, ApJ, 558, 702 [NASA ADS] [CrossRef] [Google Scholar]
- Gibb, E., Whittet, D., Boogert, A., & Tielens, A. 2004, ApJS, 151, 35 [NASA ADS] [CrossRef] [PubMed] [Google Scholar]
- Hudson, R., & Moore, M. 1999, Icarus, 140, 451 [NASA ADS] [CrossRef] [MathSciNet] [Google Scholar]
- Hulett, H., Wolman, Y., Miller, S., et al. 1971, Science, 174, 1038 [NASA ADS] [CrossRef] [Google Scholar]
- Ioppolo, S., Cuppen, H., van Dishoeck, E., & Linnartz, H. 2011, MNRAS, 410, 1089 [NASA ADS] [CrossRef] [Google Scholar]
- Kaiser, R., & Roessler, K. 1998, ApJ, 503, 959 [NASA ADS] [CrossRef] [Google Scholar]
- Kerkhof, O., Schutte, W., & Ehrenfreund, P. 1999, A&A, 346, 990 [NASA ADS] [Google Scholar]
- Kissel, J., & Krueger, F. 1987, Nature, 326, 755 [NASA ADS] [CrossRef] [Google Scholar]
- Kissel, J., Krueger, F., Silén, J., & Clark, B. 2004, Science, 304, 1774 [NASA ADS] [CrossRef] [Google Scholar]
- Knez, C., Boogert, A., Pontoppidan, K., et al. 2005, ApJ, 635, L145 [NASA ADS] [CrossRef] [Google Scholar]
- Kobayashi, K., Kasamatsu, T., Kaneko, T., et al. 1995, Adv. Space Res., 16, 21 [Google Scholar]
- LeRoy, L., Briani, G., Briois, C., et al. 2012, Planet. Space Sci., 65, 83 [NASA ADS] [CrossRef] [Google Scholar]
- Muñoz Caro, G., & Schutte, W. 2003, A&A, 412, 121 [NASA ADS] [CrossRef] [EDP Sciences] [Google Scholar]
- Muñoz Caro, G., Meierhenrich, U., Schutte, W., et al. 2002, Nature, 416, 403 [NASA ADS] [CrossRef] [PubMed] [Google Scholar]
- Muñoz Caro, G., Meierhenrich, U., Schutte, W., Thiemann, W., & Greenberg, J. 2004, A&A, 413, 209 [NASA ADS] [CrossRef] [EDP Sciences] [Google Scholar]
- Öberg, K., Garrod, R., van Dishoeck, E., & Linnartz, H. 2009, A&A, 504, 891 [NASA ADS] [CrossRef] [EDP Sciences] [Google Scholar]
- Oró, J. 1961, Nature, 190, 389 [CrossRef] [Google Scholar]
- Palumbo, M. 2005, J. Phys.: Conf. Ser., 6, 211 [NASA ADS] [CrossRef] [Google Scholar]
- Pizzarello, S., Cooper, G., & Flynn, G. 2006, Meteorites and the early solar system II, 625 [Google Scholar]
- Schutte, W. 2002, Adv. Space Res., 30, 1409 [NASA ADS] [CrossRef] [Google Scholar]
- Schutte, W., Allamandola, L., & Sandford, S. 1993, Icarus, 104, 118 [NASA ADS] [CrossRef] [PubMed] [Google Scholar]
- Schutte, W., Boogert, A., Tielens, A., et al. 1999, A&A, 343, 966 [NASA ADS] [Google Scholar]
- Strazzulla, G., & Baratta, G. 1992, A&A, 266, 434 [Google Scholar]
- Tielens, A., & Hagen, W. 1982, A&A, 114, 245 [NASA ADS] [Google Scholar]
- Vinogradoff, V., Duvernay, F., Danger, G., Theulé, P., & Chiavassa, T. 2011, A&A, 530, A128 [NASA ADS] [CrossRef] [EDP Sciences] [Google Scholar]
- Vinogradoff, V., Duvernay, F., Farabet, M., et al. 2012a, J. Phys. Chem. A, 116, 2225 [CrossRef] [Google Scholar]
- Vinogradoff, V., Rimola, A., Duvernay, F., et al. 2012b, Phys. Chem. Chem. Phys., 14, 12309 [CrossRef] [Google Scholar]
- Vinogradoff, V., Duvernay, F., Danger, G., et al. 2013, A&A, 549 [Google Scholar]
All Tables
Assigned features of the infrared spectrum of the EXP1 ice mixture H2O:CH3OH:NH3: = 10:1:1 after 56 h of VUV photolysis at 25 K.
Assigned features of the infrared spectrum of the EXP1 ice mixture H2O:CH3OH:NH3 = 10:1:1 after 56 h of VUV photolysis at 25 K and warmed at 180 K.
Assigned features of the infrared spectrum of the EXP1 ice mixture (H2O:CH3OH:NH3 = 10:1:1) after 56 h of VUV photolysis at 25 K and warmed at 260 K.
Assigned features of the infrared spectrum of the EXP1 ice mixture (H2O:CH3OH:NH3 = 10:1:1) after 56 h of VUV photolysis at 25 K and warmed at 300 K.
All Figures
|
Fig. 1 Structures of HMT (hexamethylenetetramine C6H12N4) and TMT (trimethylenetriamine C3H9N3). |
| In the text | |
|
Fig. 2 Infrared spectra between 900 and 2000 cm-1 of the EXP1 ice mixture (H2O:CH3OH:NH3=10:1:1). The spectrum before irradiation was measured after 10 min of ice deposition at 25 K without photolysis. Afterwards, we started the simultaneous ice deposition and photolysis for 56h at 25 K. The two spectra are compared with pure ice of H2CO, NH |
| In the text | |
|
Fig. 3 Infrared spectra of the EXP1 ice mixture (H2O:CH3OH:NH3 = 10:1:1) photolysed at 25 K (56h) followed by a warming at 180 K, 260 K, and 300 K, compared with pure HMT at 300 K. |
| In the text | |
|
Fig. 4 Infrared spectra of the EXP2 ice mixture (H2CO:NH3:HCOOH) warmed at 180, 260, and 330 K and the EXP3 ice mixture (CH2NH:HCOOH) warmed at 260 and 330 K, no photolysis. |
| In the text | |
|
Fig. 5 Infrared spectra of: a) EXP1 ice mixture (H2O:CH3OH:NH3= 10:1:1) after photolysis and warmed at 180 K, b) EXP2 ice mixture (H2CO:NH3:HCOOH) warmed at 180 K, compared with infrared spectrum of NH2CH2OH formed from warming of the H2CO:NH3:H2O ice mixture at c) 180 K and d) 190 K (with some residual water). |
| In the text | |
|
Fig. 6 Infrared spectra of the three mixtures at 260 K, between 2000−700 cm-1: a) EXP1 (H2O:CH3OH:NH3) ice mixture after photolysis and warmed at 260 K, b) H2CO:NH3:HCOOH ice mixture only warmed at 260 K, and c) CH2NH:HCOOH ice mixture only warmed at 260 K, compared with the B3LYP spectrum of HCOO−TMTH+ salt (from Vinogradoff et al. 2012b). |
| In the text | |
|
Fig. 7 Infrared spectra of the difference 300 K (presented in Fig. 8) minus 260 K (presented in Fig. 6) (1/1), a) H2O:CH3OH:NH3 ice mixture, b) H2CO:NH3:HCOOH ice mixture, and c) CH2NH:HCOOH ice mixture. # and ξ refer to unknown compounds in the EXP1 ice mixture, photolysed and warmed. |
| In the text | |
|
Fig. 8 Infrared spectra of three residues at 300 K, a) from H2O:CH3OH:NH3 ice mixture photolysed at 25 K and warmed until 300 K, b) from H2CO:NH3:HCOOH ice mixture only warmed until 330 K, and c) from CH2NH:HCOOH ice mixture only warmed until 330 K, compared with d) pure HMT in the same experimental conditions at 260 K, and e) pure PMI in the same experimental conditions at 500 K. κ sign to remaining HCOO− in the ice mixture. |
| In the text | |
|
Fig. 9 Mechanism of HMT formation induced by UV photons and thermal activation from interstellar ice analogues. |
| In the text | |
|
Fig. 10 Summary of HMT formation: representation of the activation barriers for the different intermediates (calculated with B3LYP/6-31G** and adapted from Vinogradoff et al. 2012b) with the corresponding temperature and time (τ) to form the intermediates in laboratory experiments. The extrapolation temperature and time were calculated by an Arrhenius law. |
| In the text | |
Current usage metrics show cumulative count of Article Views (full-text article views including HTML views, PDF and ePub downloads, according to the available data) and Abstracts Views on Vision4Press platform.
Data correspond to usage on the plateform after 2015. The current usage metrics is available 48-96 hours after online publication and is updated daily on week days.
Initial download of the metrics may take a while.