| Issue |
A&A
Volume 698, June 2025
|
|
|---|---|---|
| Article Number | A285 | |
| Number of page(s) | 11 | |
| Section | Interstellar and circumstellar matter | |
| DOI | https://doi.org/10.1051/0004-6361/202554613 | |
| Published online | 24 June 2025 | |
Synthesis of new hexamethylenetetramine-based products (HMT-R) in UV-irradiated pre-cometary ice analogues
1
Centro de Astrobiología (CAB), CSIC-INTA,
Ctra. de Ajalvir, km 4, Torrejón de Ardoz,
28850
Madrid,
Spain
2
Departamento de Física de la Tierra y Astrofísica, Facultad de Ciencias Físicas,
Universidad Complutense de Madrid,
28040
Madrid,
Spain
3
Department of Instrumental Analysis and Environmental Chemistry, Institute of Organic Chemistry (IQOG-CSIC),
Juan de la Cierva 3,
28006
Madrid,
Spain
4
Department of Physics, National Central University,
Zhongli District, Taoyuan City
320317,
Taiwan
★ Corresponding authors: This email address is being protected from spambots. You need JavaScript enabled to view it.
; This email address is being protected from spambots. You need JavaScript enabled to view it.
; This email address is being protected from spambots. You need JavaScript enabled to view it.
Received:
18
March
2025
Accepted:
11
May
2025
Abstract
Context. Laboratory experiments mimicking irradiation of ice mantles under astrophysically relevant conditions, in particular those prevailing in dense interstellar cloud interiors and the cold zones of protoplanetary discs, drive the formation of complex organic species. A fraction of these molecules are refractory at room temperature and constitute what is known as the organic refractory residue.
Aims. Because hexamethylenetetramine (HMT, (CH2)6N4) is one of the most abundant residue components, we study here the molecules based on HMT that are also present in these residues.
Methods. H2O:CH3OH:NH3 ice mixtures were irradiated with a UV lamp that reproduces the emission spectrum of secondary UV photons in dense clouds. Ice formation and irradiation were conducted under high vacuum conditions at 80 K in these experiments. A solution of the residues was analysed by means of gas chromatography-mass spectroscopy (GC–MS).
Results. Some HMT-based family members are reported here for the first time. These species could therefore be produced in icy dust grains exposed to radiation and warmed up to temperatures above 200 K. The side groups R in HMT-R derivatives provide information about the radicals that were present in the irradiated ice; these radicals were also the likely precursors of cometary species inferred from COSAC-Rosetta data. On the other hand, although HMT has been searched for unsuccessfully in comet 67P, it has been identified in meteorites. Moreover, some of the HMT derivatives reported in this study were previously detected in the Murchison meteorite. This work therefore opens the possibility of detecting new HMT-based molecules in pristine objects of the Solar System.
Key words: astrochemistry / methods: laboratory: molecular / techniques: spectroscopic / ISM: molecules / ultraviolet: ISM
© The Authors 2025
 Open Access article, published by EDP Sciences, under the terms of the Creative Commons Attribution License (https://creativecommons.org/licenses/by/4.0), which permits unrestricted use, distribution, and reproduction in any medium, provided the original work is properly cited.
This article is published in open access under the Subscribe to Open model. This email address is being protected from spambots. You need JavaScript enabled to view it. to support open access publication.
1 Introduction
There are currently a fair number of publications reporting the processing of interstellar and circumstellar ice analogues using radiation and vacuum-ultraviolet (VUV) photons, which are also referred to as UV radiation in the astrophysical literature. A typical ice mixture is a composition dominated by water, and one or more carbon-bearing species (among CH3OH, CO2, CO, and occasionally CH4) and a nitrogen source (which is often NH3 or less frequently N2). In these experiments, fragmentation of the starting molecules in the ice produces radicals and reactive species. The ice sample is monitored in situ during the UV irradiation with IR spectroscopy, and molecules ejected from the ice surface are monitored by mass spectrometry, sometimes allowing the identification of a few formed radicals (e.g. ⋅NH2, ⋅NH, ⋅CH3) and simple neutral species such as H2CO. Warming up the irradiated ice mixture enhances the radical-radical and radical-molecule reaction rates. During sublimation of the starting ice molecules, which occurs near 170 K for H2O in our experiments and at lower temperatures for the other species, the desorption of photoproducts embedded in the ice bulk is also observed. What remains at room temperature is known as ‘yellow stuff’ or simply called ‘the residue’. Despite the unappealing names, these residues contain a plethora of organic compounds, and many of them are of astrobiological interest (Muñoz Caro et al. 2025)
Hexamethylenetetramine (HMT) is one of the most abundant residue components detected by gas chromatography coupled to mass spectrometry (GC–MS), in particular when the starting ice composition is a mixture of H2O, CH3OH, and NH3, although this species is also produced when CO is the carbon source in the irradiated ice mixture. Furthermore, it is one of the few species that can be detected by chromatography without acid hydrolysis or derivatisation of the residue. The characteristic infrared (IR) bands of HMT also allow its detection by IR spectroscopy of the residue (Briggs et al. 1992; Bernstein et al. 1995; Cottin et al. 2001; Muñoz Caro & Schutte 2003; Muñoz Caro et al. 2004). The synthesis of HMT derivatives in ice irradiation experiments of interstellar ice analogues has been reported (Muñoz Caro et al. 2004; Danger et al. 2013; Materese et al. 2020; Urso et al. 2020). In residues made from H2O:CH3OH/CO2/CO2: NH3 ice mixtures, Muñoz Caro et al. (2004) identified HMT-CH3, HMT-OH, HMT-CH2OH, HMT-CHOH-CHO, and HMT-NH-CHO with relative-to-HMT abundances in the range from 0.005% to 12%.
HMT has been identified as a meteoritic component in Murchison, Murray, and Tagish Lake carbonaceous chondrites (Oba et al. 2020). These authors also report three HMT derivatives in Murchison (HMT-CH3, HMT-OH, and HMT-NH2), as well as evidence of the presence of HMT-CH2OH or its isomers.
Meierhenrich et al. (2005) reported the identification of several nitrogen heterocycles in the residues using GC–MS with derivatisation. Among them, the most abundant was hexahydro-1,3,5-triazin, also known as trimethylenetriamine (TMT). In condensation reactions between ammonia and formaldehyde in aqueous solution at room temperature, TMT was proposed as a precursor of HMT (Meissner et al. 1954). The rather complex reaction pathway proposed by these authors to synthesise HMT was adopted to explain the formation of HMT in the ice irradiation experiments (Bernstein et al. 1995; Muñoz Caro & Schutte 2003; Vinogradoff et al. 2013).
HMT formation is thought to proceed in the ice exposed to radiation and subsequent warming after methyleneimine (H2C=NH) is formed from CH3OH and NH3. Therefore, to simplify the synthesis of HMT in the ice irradiation experiments and gain more insight into its formation pathway, methylamine (CH3NH2) was used as the ice precursor to generate methyleneimine during irradiation. In these experiments, trimethylenetriamine (TMT, c-(-CH2-NH)3) was formed by trimerisation of methyleneimine (H2C=NH), and the role of TMT as an HMT precursor was confirmed (Carrascosa et al. 2021).
In the present work we carried out the experimental simulation of the chemical evolution of pre-cometary ices. We performed UV irradiation followed by warming to room temperature of H2O:CH3OH:NH3 ice mixtures deposited at 80 K. The products formed in the residues were analysed by gas chromatography coupled to mass spectrometry (GC–MS). A detailed interpretation of the mass spectra associated with each chromatographic peak led to the identification of 17 HMT derivatives, confirming previously reported species and identifying others for the first time. The elution time of each HMT derivative in the chromatogram showed a correlation with its polarity and molecular mass. As with HMT, these compounds were detected directly by GC–MS without any pretreatment of the residue, i.e. acid hydrolysis or derivatisation of the samples was not carried out before the analysis. Prior to GC–MS analysis, it was found that storage of the residues for a few days under vacuum or in an inert atmosphere still affected the relative abundances of HMT derivatives, suggesting the semi-refractory nature of these compounds as well as the critical importance of the pretreatment phase before the GC–MS analysis. Finally, the possible formation pathways of these species in the ice were discussed. The side groups attached to the HMT structure are related to radicals and reactive species generated in UV-irradiated ice, which ultimately led to the formation of complex organic species detected in the residues at room temperature.
2 Experimental set up
2.1 MOSS set-up presentation
Simulation of the chemical evolution of pre-cometary ices was carried out in the new experimental set-up Mimicking Organic Synthesis in Space (MOSS) at the Centro de Astrobiología (CAB, CSIC-INTA). MOSS is a chamber designed and optimised for the production of organic refractory residues of astrophysical interest. The MOSS set-up is described below:
Pumping system: the chamber is evacuated by a primary pump coupled to a HiCube 80 turbo-molecular pump with a pumping capacity of 671 s−1, reaching a pressure below 10−7 mbar at room temperature.
Gas line: the gas line is designed for the preparation of multi-gas mixtures under controlled conditions. The chamber allows two inlets, one for vapours such as H2O and CH3OH and one for gases such as NH3. The two inlets are independent of each other in order to avoid possible reactions prior to the ice formation. The gas inlet line is evacuated at a pressure of about 0.1 mbar by a scroll pump.
Main chamber: gases are introduced into the main chamber through two deposition tubes oriented towards the sample holder. These are deposited on a KRS-5 substrate (thallium bromoiodide, 2 cm in diameter) supported by a cold finger cooled by liquid nitrogen. The temperature range at the sample position ranges from 80 K to room temperature.
Vacuum UV lamp: simultaneously with the deposition, the ice samples are irradiated with UV photons generated by a deuterium arc lamp (X2D2 L9841, Hamamatsu) positioned in front of the sample. The arc is encased in a MgF2 glass bulb. A 10 mm diameter cylindrical quartz tube is placed between the lamp and the sample holder, 2 cm from the sample. This tube acts as a photon guide to maximise the flux of the lamp at the sample position. The emission range of the lamp allowed by the MgF2 window is located between 115 and 180 nm (10.78−6.89 eV). The main emission bands are Ly−α at 121.6 nm (10.20 eV) and the molecular hydrogen bands in the range 155−165 nm (8.00 − 7.51 eV), with a total flux produced by the lamp of about 5 × 10¹⁴ photons s−1 cm−2 measured with a calibrated Ni-mesh. After deposition and irradiation of the sample, the supply of liquid nitrogen is stopped and the ice is slowly warmed up with no programmed ramp to room temperature, leaving a refractory residue on the surface of the substrate. Once the substrate is removed from the high vacuum chamber, the formation of the residue is confirmed using Fourier transform infrared spectroscopy (FTIR) in transmittance mode with a Bruker Vertex 70 spectrometer at a resolution of 1 cm−1. The substrate covered by the residue is stored inside a capsule in a nitrogen atmosphere to prevent any alteration until chromatographic analysis.
2.2 Residue formation from mixtures of H2O:CH3OH:NH3
The gas mixtures prepared for our experiments contain different ratios of distilled MiliQ H2O, which was obtained from an IQ-7000 Millipore system; CH3OH high-performance liquid chromatography (HPLC)-grade supplied by Panreac; and NH3 99.96%, purchased from Air Liquide. Experiments with 13C-labelled methanol (Sigma-Aldrich) were carried out to determine the number of carbon atoms in the products. The gases and vapours were introduced into the chamber at a pressure in the range of 10−5 mbar and deposited on the substrate at T ≈ 84 K, while simultaneously irradiated with UV photons during 12 h for experiments (Exps.) 1, 2, and 3 and 6 h for Exps. 4 and 5.
2.3 Analysis of residues by GC–MS
The organic residues were analysed by gas chromatography coupled with mass spectrometry (GC–MS) at the Instituto de Química Orgánica General (IQOG-CSIC). Each organic residue was extracted from the substrate surface with 2 mL of methanol. Subsequent FTIR analysis of the KRS-5 window confirmed the complete solubility of the residue in methanol, leaving no trace in the window. Nevertheless, methanol-insoluble species that have no dipole moment would not be observable in the IR and may remain in the window. Further analysis, which is beyond the scope of this work, will be done to analyse the nature of those compounds. Then 1.5 mL of the solution containing the residue were dried under a current of N2 at 40∘C and reconstituted with 10 μL of methanol. Volumes of 1 μL of this concentrated solution (2 μL for Exps. 4 and 5 to account for the two times shorter simultaneous deposition and irradiation time) were injected in splitless mode at 290∘C into an Agilent 7890 B gas chromatograph coupled to an Agilent 7010 B triple quadrupole (QqQ) mass spectrometer, equipped with a high-efficiency electron impact (EI) ionisation source, applying a voltage of 70 eV and working in SCAN mode in the second quadrupole. For the carrier gas, helium was used in a constant flow mode of 1.5 mL/min. The oven was equipped with a DB35 MS column (30 m × 250 μm × 0.25 μm, Agilent J&W, USA) following a temperature ramp from 60∘C to 180∘C at 5∘C/min with a plateau of 5 min , and from 180∘C to 300∘C at 15∘C/min, holding at this temperature for 15 min.
Summary of HMT derivatives detected by GC–MS with their corresponding retention time and molecular ion detected.
3 Results and discussion
Figure 1 shows the IR spectra of the residues after removal from the high vacuum chamber. Table 1 presents a summary of the results obtained by GC–MS analysis of the residues generated by photolysis of H2O:CH3OH:NH3 mixtures in different ratios. Experiments 1 and 2, enriched in water, were performed to verify the reproducibility in experiments with the same composition. Experiments 3 and 4 were carried out to compare the effect of storage time (i.e. the time interval between the completion of residue formation at room temperature and its ex situ analysis), which was 3 days for Exp. 3 and 1 day for Exp. 4. Finally, Exp. 5, H2O:CH3OH:NH3 = 2:1:1 with a storage time of 12 hours, was performed as a standard experiment where the composition was similar to previous works.
The detected species are listed with their corresponding retention time in the chromatogram and molecular mass. The last five columns show the relative abundance of each species with respect to HMT in the residue sample, calculated from integration of the area of the chromatographic peaks obtained in each of the experiments performed in this work. Figure 2 illustrates the gas chromatograms corresponding to the residues analysed in Exps. 3 and 4. The identification of the peaks observed in the chromatograms is described in detail in the following sections.
 |
Fig. 1 Top IR spectrum: residue of Exp. 2 at the moment of removal from high vacuum chamber. Middle IR spectrum: Residue of Exp. 2 after 5 days in storage under N2 atmosphere at 20∘C. The bands related to HMT diminish with storage time, pointing out the importance of the analysis time, as well as storage conditions. Bottom IR spectrum: HMT standard (Sigma-Aldrich 99%). |
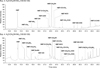 |
Fig. 2 Gas chromatograms of the residues produced by irradiation of H2O:CH3OH:NH3 (100:50:100) ices at 84 K , followed by warming to 300 K. The residue from Exp. 3 was stored for 60 h in MOSS (P = 10−7 mbar) until analysis by GC–MS, while that from Exp. 4 was stored for 9 h. |
3.1 Detection and quantification of HMT in analogues of interstellar and cometary organic residues
Infrared spectroscopy at room temperature showed that all the vibrational bands present in the HMT standard spectrum were present in the residues (Fig. 1). Figure 3 (top left panel) shows the mass spectra of the compound which elutes at a retention time of 14.10 min in the chromatograms of the analysed residues. Hexamethylenetetramine (HMT) is the species responsible for this peak, with a molecular mass of 140 g/mol. The identification was obtained by comparison with an HMT standard (Sigma-Aldrich, purity 99%), whose retention time and mass spectrum were identical to those observed at 14.10 min retention time in the residues.
The formation yield of HMT in the residues was obtained from the ratio of the IR column density of HMT formed to the column density of the ice deposited in each experiment. The column density of the deposited ice was roughly estimated from the deposition time with a growth rate of (8 ± 3) × 1016 molecules cm−2 s−1. The column density of the HMT was determined by the average of the integration of the 1235 and 815 cm−1 IR absorptions of HMT using equation (1):
 (1)
(1)
Here N is the column density in cm−2, τv the optical depth of the band, dν the wavenumber differential in cm−1, and A the band strength in cm molecule−1. A band strength of 2.6 × 10⁻¹⁸ cm molecule−1 was used for the feature at 1235 cm−1, as reported by Bernstein et al. (1995), while a band strength of 1.4 × 10⁻¹⁸ cm molecule−1 was calculated for the feature at 815 cm−1 from Eq. (1). The result is an HMT formation yield of (0.02 ± 0.01)%, which corresponds to a carbon conversion rate of (0.4 ± 0.2), in line with the results obtained by Muñoz Caro & Schutte (2003). Other species in the residue may contribute to the integrated bands. Nevertheless, the column density estimation of HMT in the residues using either the 1235 or the 815 cm−1 band are similar, and the specificity of these vibrations, in particular the v23CH2 rock in HMT corresponding to the 815 cm−1 band, suggests that there should be little contribution from other species.
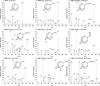 |
Fig. 3 Mass spectra and molecular structures corresponding to the compounds detected in our experiments and listed in Table 1 from Nos. 1 to 9, arranged according to their retention times. |
3.2 Identification of HMT derivatives
The main mass fragments of HMT included m/z = 42, 58, 84, 98, and 112. These fragments were identified in a total of 18 chromatographic peaks of the residues analysed in this study (corresponding to HMT and 17 HMT derivatives). In the absence of standards to compare intrinsic properties of each molecule, such as retention time and fragmentation patterns, the identification of each HMT derivative was based on the detailed interpretation of their mass spectra, presented in Figs. 3 and 4, where these species are ordered according to retention time (see Table 1). Furthermore, 13CH3OH served to confirm the presence of all HMT derivatives in separate experiments.
3.2.1 HMT-CH3
At a retention time of 15.83 min , a compound elutes that exhibits a relative abundance of 25% (considering the same sensitivity in the GC detector) with respect to HMT in Exp. 4. The mass spectrum indicates that the molecular ion of the parent species is 154 g/mol. The fragment m/z = 139 could be explained by the loss of a hydrogen atom from the main structure of HMT. The 15 g/mol difference between the molecular ion and the fragment m/z = 139 suggests the cleavage of a methyl group (-CH3). Consequently, it is proposed that this peak corresponds to HMT-CH3.
After analysis of all the HMT derivatives, two fragmentation mechanisms leading to two different m/z ratios were common to most species. Both are explained hereafter using HMT-CH3 as a representative example. Then, the mechanisms from Figs. 5 and 6 are evoked along the identification of all the HMT derivatives.
The fragment m/z = 125 is not detected in the mass spectrum of pure HMT, suggesting that it can be generated exclusively when HMT has side groups. We propose a fragmentation mechanism to explain the formation of this fragment, which involves the loss of a CH2N group adjacent to the CH-R-H group (R-H = CH2-H in this case). Then, the formation of a bond between the substituted CH and the free CH2 group is favoured. Finally, the nucleophilic attack from the unpaired electrons of a free nitrogen displace a H atom from the R-H group, re-establishing a cage structure composed of five- and six-membered cycles, as illustrated in Figure 5. The fragmentation mechanism shown in Figure 5 explains the presence of a m/z peak at 125 observed during HMT-CH3 elution.
The fragment m/z = 42, observed in the mass spectra of the derivatives and in pure HMT, can be associated with the fragmentation of HMT producing N-CH2−N or CH2-N-CH2 groups. In HMT derivatives, five of these fragments would contain the side group (CH3 in this case, adopting configurations such as N-CH(R)-N or R-CH-N-CH2; see Figure 6). It is well known that fragmentations are favoured when more substituted atoms are involved, as this leads to the formation of a more stable radical or carbocation. This mechanism would generate a fragment with a mass equal to 41 plus the mass of the side group. In the case of the HMT-CH3 derivative, the cleavage of this group would give rise to a fragment m/z = 56, clearly visible in the mass spectrum.
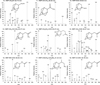 |
Fig. 4 Mass spectra and molecular structures corresponding to the compounds detected in our experiments and listed in Table 1 from Nos. 10 to 18 , arranged according to their retention times. |
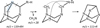 |
Fig. 5 m/z = 111+R fragment in the mass spectra of HMT-R-H derivatives suggests a fragmentation mechanism involving the loss of one of the CH2N groups (highlighted in blue) upon ionisation in the filament of the QMS adjacent to the CH-R-H group (where R-H represents the characteristic side group of each HMT derivative, e.g. CH3, NH2, OH, and CHO), giving rise to fragments with a mass of 111 + R g/mol. |
 |
Fig. 6 m/z = 41+R fragment in the mass spectra of HMT-R derivatives suggests the loss of a N-CH(R)-N or R-CH-N-CH2 fragment (marked) upon ionisation in the filament of the QMS. In an HMT-R molecule there are four cleavages generating the R-CH-N-CH2 fragment (marked in blue) and one generating the N-CH(R)-N fragment (marked in red). |
3.2.2 HMT-CH2NH2
At a retention time of 17.08 min a peak with a relative abundance to HMT of 3% is observed. The corresponding mass spectrum shows the fragments m/z = 42, 84, and 139 , which are characteristic of the HMT radical. It also shows a significant fragment with a mass of 169 g/mol, which could correspond to the molecular ion, suggesting that the side group of this derivative has a mass of 30 g/mol. According to the nitrogen rule, because the molecular mass is odd, the derivative must contain an odd number of nitrogen atoms. Then, only two possibilities appear: one side group being -CH2NH2, or a doubled HMT substitution to produce CH3-HMT-NH2. The fragment m/z = 138 could support the possibility of the derivative CH3-HMT-NH2 since it would indicate the substitution of two hydrogens on different carbons or even on the same carbon. However, m/z = 141 derives from the fragmentation proposed in Figure 5–where CH2NH2 is the side group. The fragment m/z = 156 can be attributed to the cleavage of the -NH2 group in HMT-CH2NH2, with the addition of a hydrogen, or to the loss of a -CH3 or -NH2 group in CH3-HMT-NH2. Since the base peak of the spectrum at m/z = 72 is associated with the fragmentation mechanism described in Figure 6, with the side group -CH2NH2, we propose that this compound corresponds to HMT-CH2NH2, although the double-substituted CH3-HMT-NH2 cannot be completely discarded.
3.2.3 HMT-CH2CH3
Another compound elutes at 17.51 min with a relative abundance of 3% with respect to HMT (Exp. 4). The mass spectrum of this species shows a molecular ion of 168 g/mol and fragments m/z = 42, 112, and 139, indicating similarities to the structure of HMT. The side group has a mass of 29 g/mol, and the fragmentation at m/z = 154 can be attributed to the loss of a CH3 group, with the addition of a H. These data are consistent with the structure of the HMT-CH2CH3 derivative.
The base peak (m/z = 70) is associated with the fragmentation described in Figure 6, where R = CH2CH3. Meanwhile, the fragment m/z = 125 results from the route proposed in Figure 5, where the cleavage of a CH2N fragment is followed by the loss of the CH3 group from the side substituent, instead of losing a single H , as happens for other derivatives.
3.2.4 HMT-NH 2
In Exps. 1, 2, 3, and 5 a molecule is observed at 17.53 min. Its mass spectrum presents the fragments m/z = 42, 58, 85, 112, and 139, characteristic of HMT. The base peak, m/z = 154, could correspond to the molecular ion of the HMT-CH3 derivative. However, this compound has unambiguosly been reported with a retention time of 15.83 min. The fragment m/z = 126 results from the fragmentation described in Figure 5, where the side group matches that of NH2. We propose that m/z = 155 is the molecular ion, resulting in m/z = 154 after the loss of a H atom in the mass spectrometer detector.
3.2.5 HMT-N=NH
In the chromatogram of Exp. 4, a peak is identified at 17.58 min with a relative abundance to HMT of 1%. The mass spectrum shows a molecular ion at 168 g/mol, and the absence of fragments between the HMT radical ion (m/z = 139) and the molecular ion of the parent species indicates that the side functional group is not favourably fragmented in the MS detector. Since the molecular mass is even, it can be deduced that the functional group contains an even number of nitrogen atoms, which supports the assignment of this peak to the HMT-N=NH derivative.
Although other functional groups, such as -CHO, might match the assignment, a compound with similar fragmentation patterns elutes at a retention time of 21.78 min (Sect. 3.2.7). Considering the elution order as a function of polarity, it is consistent that HMT-N=NH, with a lower polarity due to the azomethine group (-N=NH) elutes before HMT-CHO, whose carbonyl group (C=O) is more polar.
The fragment m/z = 126 is attributed to the fragmentation pathway described in Figure 5, where the NH cleavage of the N=NH group and the addition of a hydrogen to the remaining nitrogen occurs, generating stable five- and six-membered cycles. Finally, the base peak (m/z = 70) originates from the cleavage of the N-CH2(N=NH)-N or CH2-N-CH2-N=NH unit.
3.2.6 HMT-OH
At a retention time of 19.18 min , a species with an abundance of 4% relative to HMT is detected in Exps. 1, 2, and 3. It is also detected, although with lower abundance, in Exps. 4 and 5. The mass spectra show the characteristic ions of the HMT radical (m/z = 42, 58, 69, 84, 98, and 139), as well as a peak at 156 g/mol attributed to the molecular ion. This indicates that the side group has a mass of 17 g/mol, allowing the molecule to be assigned to the HMT-OH derivative. The fragment m/z = 127 is interpreted as a result of the loss of CH2N and a H atom from the -OH group, which generates a cycle, in line with the fragmentation pathway described in Figure 5.
3.2.7 HMT-CHO
A peak detected at 21.78 min , with an abundance of 2% relative to HMT in Exps. 1 and 3, displays a molecular ion at 168 g/mol in its mass spectrum. The fragments m/z = 58, 98, and 112 confirm the structural similarity to HMT. The absence of peaks between the HMT radical ion (m/z = 139) and the molecular ion of the parent species suggests that the side functional group does not undergo fragmentation. This behaviour is consistent with the assignment of the peak to HMT-CHO. As mentioned in Sect. 3.2.5, the compounds eluting at 17.58 min (HMT-N=NH) and 21.78 min (HMT-CHO) show very similar fragmentation patterns. However, their tentative assignment is done considering the order of polarity in the elution. Since carbonyl groups (C=O) are more polar than azomethine groups (-N=NH), it is consistent that HMT-CHO elutes after HMT-N=NH. The fragment m/z = 126 is attributed to the loss of CH-CHO, while the base peak (m/z = 139) reflects contributions from both HMT radical fragmentation and CH2N cleavage, following the fragmentation pathway described in Figure 5.
3.2.8 HMT-O-CH2CH3
The peak observed at 22.15 min is detected with a maximum relative abundance of 16% with respect to HMT in Exp. 4. The associated mass spectrum shows a molecular ion at m/z = 184, suggesting the presence of a side functional group with a mass of 45 g/mol. The fragment ion m/z = 155 and the absence of m/z = 154 or m/z = 153 is indicative of an oxygen atom bonded to the carbon atom of the HMT radical, while a remaining fragment with mass 29 g/mol could correspond to -CH2CH3 or -CHO. Therefore, the two possible side groups coherent with the mass spectra are -O-CH2CH3 and -O-CHO.
At 33.78 min a compound with a similar fragmentation pattern elutes, indicating that it could correspond to an HMT derivative including one of these two side groups (Sect. 3.2.17). Considering that the alkyl group (-CH2CH3) reduces the polarity of the molecule further than the carbonyl group (-CHO) of HMT-O-CHO, it is reasonable to assign the peak at 22.15 min to the HMT-OCH2CH3 derivative.
The m/z = 86 ion can be attributed to the cleavage of the N-CH2(R)-N or CH2-N-CH2-R units (where R=O-CH2CH3), as described in Figure 6. The m/z = 127 fragment is generated via the fragmentation pathway presented in Figure 5. In this process, the loss of CH2N from the HMT radical is combined with the cleavage of the -CH2CH3 group from the side substituent, allowing the oxygen to complete a stable cycle.
3.2.9 HMT-CH2OH
At a retention time of 22.76 min a compound present in all experiments is detected, which in Exp. 3 reaches an abundance relative to HMT of 152%. The mass spectrum shows a significant molecular ion at m/z = 170, suggesting a formula compatible with the incorporation of a 31 g/mol functional group to HMT. The fragment m/z = 101 corresponds to a fragment of empirical formula C3H7N3O. The ion m/z = 141 is attributed to the loss of CH2N and the formation of an oxygen stabilised cycle, as described in Figure 5. Based on this fragmentation pattern, we assign this compound to the HMT-CH2OH derivative, whose formation has already been reported in studies on processed interstellar ice analogues (Muñoz Caro & Schutte 2003; Oba et al. 2020; Danger et al. 2013; Materese et al. 2020), where similar fragmentation patterns were observed. The high abundance of HMT-CH2OH can be related to the high abundance of the -CH2OH radical during the simultaneous deposition and irradiation of the ice samples.
3.2.10 HMT-CO-CH3
Another compound elutes at a retention time of 23.32 min , with an abundance of 3% in Exps. 3 and 4. Its mass spectrum shows a molecular ion at m/z = 182 and a base peak at m/z = 139, corresponding to the HMT radical, suggesting that the side group has a mass of 43 g/mol. Isotopic labelling with methanol 13C shows the same peak with a molecular mass of 190 g/mol. Since HMT contains six carbon atoms, the remaining two carbon atoms must belong to the side group, whose molecular formula would be C2H3O. Based on the absence of side group fragmentations, a plausible candidate for this compound is HMT-CO-CH3. In the ketone family, fragmentation of the bond between the C=O group and the longer chain (in this case, the HMT radical) is favoured over fragmentation of the bond between the C=O group and the -CH3.
3.2.11 HMT-NCO
At a retention time of 23.62 min , a peak with an abundance relative to HMT of 2% is detected in Exp. 3. The mass spectrum reveals a molecular ion at m/z = 182. The predominance of the ion m/z = 140 over m/z = 139 suggests that the side group is not bonded to the carbon atom substituting a hydrogen; instead, it would be bonded to the nitrogen atom. The presence of an isocyanate side group (-N=C=O) bonded to a nitrogen atom of the HMT is proposed. The fragment ion at m/z = 84 originates from the cleavage of R-N-CH2-N or CH2-N(R)-CH2 units, where R=−N=C=O. The fragmentation peak at m/z = 154 can be attributed to the loss of a CO group. The cleavage of a CH2N fragment also contributes to this ion. The absence of mass signals around m/z = 84, 90, or 154 suggest a dehydrogenated side group, reinforcing the assignment to HMT-N=C=O.
3.2.12 HMT-CH2-CO-CH3
In the chromatogram of Exp. 4, a peak is detected at a retention time of 25.07 min with a relative abundance to HMT of 2%. The mass spectrum gives the molecular ion peak at 196 g/mol, suggesting the presence of a side functional group with a mass of 57 g/mol. The fragment ion at m/z = 153 indicates that the group contains a CH2 added to the HMT radical (m/z = 139), while a remaining fragment with mass 43 g/mol could correspond to -CO-CH3 or -CH2-CHO. Therefore, the two possible side groups satisfying these observations are -CH2-CO-CH3 and -CH2CH2-CHO. A frequent mass spectra fragmentation involves cleavage of the bond adjacent to the CO group, giving rise to the ion at m/z = 167 for the -CH2-CH2-CHO side group or the ion at m/z = 153 for the CH2-CO-CH3 side group. Based on the observed fragmentation pattern, we propose the assignment of this peak to the HMT-CH2-CO-CH3 derivative. The base peak at m/z = 98 is associated with the fragmentation described in Figure 6. The m/z = 125 ion, absent in the mass spectrum of pure HMT, could originate from the loss of the CH2N fragment, followed by the cleavage of -CO-CH3 from the side group. This process would allow the formation of a stabilised cycle via the rearrangement pathway presented in Figure 5.
3.2.13 HMT-C2H4-CHO
In the chromatogram of Exps. 4 and 5, a compound eluting at a retention time of 25.37 min is detected. In addition to the characteristic ions of the HMT radical (m/z = 42, 58, 98, 112 and 139), the mass spectrum reveals a molecular ion at m/z = 196, indicating the presence of a side functional group with a mass of 57 g/mol. The fragment ion at m/z = 167 could originate from the cleavage of a CHO functional group from the side group, as described in Section 3.2.12. In addition, the ion at m/z = 154 suggests the presence of a CH3 group attached to the carbon of the HMT radical. These observations are consistent with the assignment of this compound to the HMT-CH2-CH2-CHO derivative.
3.2.14 HMT-CH2-CHO
Chromatograms derived from Exps. 3, 4, and 5 reveal a compound eluting at 25.57 min with a molecular ion peak at m/z = 182 in its mass spectrum. This indicates an HMT-substituted species containing a side group with a mass of 43 g/mol. The fragment ion at m/z = 153 points to a CH3 group replacing a hydrogen atom in the HMT radical, while the remaining fragment of the side group, with a weight of 28 g/mol, corresponds to CHO. Furthermore, HMT-CH2-CH2-CHO eluted at a similar time (Sect. 3.2.13), suggesting two species with similar polarity, i.e. another aldehyde derivate of HMT. Based on the evidence, we assigned this peak to HMT-CH2-CHO.
3.2.15 HMT-NH-CHO
A peak was detected at a retention time of 29.35 min with an intensity of 10% relative to HMT in Exps. 1 and 2. The associated mass spectrum reveals a molecular ion at 183 g/mol, indicating that the side group of the substituted HMT has a mass of 44 g/mol. Since the molecular mass of this compound is odd, the functional group contains an odd number of N atoms. Fragment ions m/z = 154 and 155 are indicative of the presence of an NH group attached to the C of the substituted HMT, allowing this peak to be assigned to the compound HMT-NH-CHO. The fragment m/z = 126, not observed in the HMT fragmentation pattern, is generated by the loss of the CH2N group and the fragmentation of the side group, forming a cycle through the NH functional group, as illustrated in Figure 5. The base peak (m/z = 85) corresponds to the cleavage of the N-CH(R)-N/R-CH-N-CH 2 unit (where R=NH-CHO), as represented in Figure 6.
3.2.16 HMT-CH(CH3)-CH2NH2
In Exp. 5, another species was detected with a retention time of 31.24 min and a relative abundance of 4% with respect to HMT. Its mass spectrum shows a molecular ion at m/z = 197. Experiments with 13C indicate that this compound contains nine carbon atoms. Since the HMT radical contains six carbon atoms, the side group must contribute the remaining three. The ion at m/z = 154, containing seven carbon atoms, corresponds to a CH3 group attached to the HMT radical, while the ion at m/z = 168, with eight carbon atoms, is attributed to the HMT-CH2CH3 fragment. The remaining fragment, containing a single carbon atom, is assigned to -CH2NH2, suggesting that this peak corresponds to the HMT-CH(CH3)-CH2NH2 derivative. Its high molecular weight explains its elution at long retention time.
3.2.17 HMT-O-CHO
The last HMT derivative elutes at a retention time of 33.78 min with an abundance relative to HMT of 5% in Exp. 1. Its mass spectrum shows a peak corresponding to the molecular ion at m/z = 184, suggesting that the side group attached to HMT has a mass of 45 g/mol. The fragment m/z = 155 is indicative of the presence of an oxygen atom bonded to the carbon of the HMT radical, while a remaining fragment with mass 29 g/mol could be attributed to -CH2CH3 or -CHO. The HMT-o-CHO derivative is the most plausible candidate responsible for the observed peak, for the following reasons: (1) the carbonyl group (-CHO) increases the polarity of the molecule more than the alkyl group (-CH2CH3) and (2) more polar compounds tend to elute at high retention times on this chromatographic column. The less polar derivative, HMT-OCH2CH3, was detected previously eluting at 22.15 min in the same experiment. The fragment ion m/z = 127, absent in the HMT fragmentation pattern, is generated by the fragmentation pathway described in Figure 5. In this mechanism, the loss of a CH2N group from the HMT radical is accompanied by the cleavage of the CHO group from the side substituent, allowing the oxygen to form a stable cycle.
3.3 Synthetic pathway of HMT derivates
The synthetic pathway of HMT in aqueous solution, explained by Meissner et al. (1954), has been commonly applied to conditions close to those of our experiments, i.e. to the chemistry of interstellar ices (Bernstein et al. 1995; Muñoz Caro & Schutte 2003; Muñoz Caro et al. 2004; Vinogradoff et al. 2012). In general terms, irradiation of ices containing water, methanol, and ammonia leads to the formation of formaldehyde through the oxidation of methanol with the loss of H2. Formaldehyde is a highly reactive molecule that, in the presence of NH3, leads to the formation of methyleneimine (H2C=NH). This imine group tends to polymerise, giving rise to a six-membered ring known as trimethylenetriazine (TMT). Reaction with three molecules of formaldehyde results in the addition of CH2OH groups on the three nitrogen atoms of TMT, forming what is known as the TMT-triol. Based on the relative abundances of formaldehyde and HMT, Muñoz Caro & Schutte (2003) estimated that the processes involving formaldehyde must occur during irradiation, due to its high tendency to form complex species. Subsequently, the addition of NH3 and molecular folding lead to the formation of HMT. Carrascosa et al. (2021) demonstrated the formation of HMT at 230 K , suggesting that the presence of NH3 at high temperatures is due to its retention in the form of the ammonium carboxylate salt (Muñoz Caro & Schutte 2003).
Muñoz Caro et al. (2004) and Materese et al. (2020) proposed that the formation of HMT-derived species occurs by the addition of functional groups to HMT precursors at low temperatures. This substitution allows the formation of the HMT skeleton, but generates HMT-R derivatives. For example, in the TMT-triol formation step, the addition of an aldehyde more complex than formaldehyde (R-CHO) to the TMT would lead to the synthesis of HMT-R. Several R-CHO aldehydes, such as CH3-CHO, NH2CH2-CHO, CH3CH2-CHO, NH2-CHO, HO-CHO, C2H5O-CHO, and HOCH2-CHO, have been reported in lowtemperature interstellar ice analogues (Martín-Doménech et al. 2020; Marks et al. 2023; Qasim et al. 2019; Allamandola et al. 1988) and detected in the interstellar medium (McGuire 2022). However, this pathway does not explain the formation of TMT-R derivatives detected in residues by GC–MS (Meierhenrich et al. 2005), and therefore additional mechanisms must be considered. Another possibility is that one of the three H2C=NH monomers forming TMT is replaced by another species in the ice. Its substitution by ethanimine (CH3CH=NH), which has been reported to form in ice and has been confirmed to be present in the ISM (Canta et al. 2023), would lead to the formation of TMT-CH3. Reaction with three molecules of formaldehyde would lead to the formation of TMT-(CH2OH)3-CH3. Finally, the addition of NH3 and molecular folding would produce HMT-CH3, as shown in Figure 7.
In summary, UV irradiation and warming of ices can induce the addition of R functional groups to HMT precursors by the substitution of hydrogen atoms at any step of their formation. As shown in Figure 8, any hydrogen in HMT precursors can be functionalised. Most of these radicals or intermediate neutral species are not detectable in situ in the ice by IR spectroscopy during irradiation and heating. However, their involvement in the synthesis of HMT derivatives provides indirect evidence for their presence in irradiated ice mixtures. This is because HMT derivatives can be subsequently identified in the chemical analysis of residues performed at room temperature, as reported in this study.
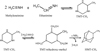 |
Fig. 7 Proposed mechanism for the formation of HMT-CH3 from the commonly accepted formation mechanism of HMT (Meissner et al. 1954; Carrascosa et al. 2021). The substitution of a methyleneimine molecule by an ethanimine (CH3CH=NH) leads to the formation of TMT- CH3. The methyl group remains in the HMT structure, finally forming HMT-CH3. |
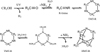 |
Fig. 8 Mechanism of HMT formation, where the hydrogens of the HMT precursors are susceptible to R-group substitution to form HMT-R. |
4 Conclusions and astrophysical implications
We have detected 17 HMT derivatives in organic residues generated by photolysis of interstellar ices analogues, followed by warming to room temperature, thus simulating molecular evolution processes prior to star formation. The HMT derivatives reported in Muñoz Caro et al. (2004) were confirmed; these are HMT-CH3, HMT-OH, HMT-CH2OH, HMT-NHCHO. Only a compound of mass 198 g/mol was not detected in our residues. The HMT-C2H5O derivative, proposed by Danger et al. (2013) and Urso et al. (2020), has been identified in our residues as the HMT-O- CH2CH3 isomer. In addition, new family members were identified in this work with their corresponding relative-to-HMT abundances, as displayed in Table 1. There are no commercial standards available for these species, with the exception of HMT. Therefore, a detailed interpretation of the individual mass spectra of each compound was carried out, proposing possible fragmentation pathways (Figures 5 and 6) based on the data obtained, and providing the mass spectra of the 12 HMT derivatives detected for the first time.
Unlike the HMT molecule, their derivatives have a dipole, and could therefore potentially be observed with radio telescopes. It is important to note that the generally low relative abundance of these derivatives (with the exception of HMT-CH2OH) would present a challenge for their astronomical detection, requiring considerably long integration times to improve the signal-to-noise ratio. Along with the molecular mass and dipole moment, other parameters lead to longer retention times in gas chromatography (Kaliszan 1992). The computed dipole moments of various HMT derivatives (Bera et al. 2019) detected in our residues is compatible with their retention times in our GC–MS analysis. For instance, the lowest retention time, 15.83 min , is that of HMT-CH3 with the lowest dipole moment, 0.21 D, and mass, 154 g/mol. Compared to HMT-CH3, HMT-NH2 and HMT-OH with only slightly higher masses displayed significantly longer retention times, respectively 17.53 and 19.18 min , owing to their larger dipole moments of 1.23 and 1.51 D. At longer retention times, species with a higher mass and higher dipolar moment were detected, such as HMT-NH-CHO (whose calculated dipole moment is 4.54 D). In general terms, the elution order of the HMT derivatives followed the expected order of polarity.
The formation pathways of the reported HMT derivatives in the H2O:CH3OH:NH3 ice mixtures exposed to UV irradiation and subsequent warming is more challenging. Their monitoring by in situ IR spectroscopy of the ice is hindered by the presence of other bands associated with the numerous compounds that conform the residues, and in addition, the computed IR spectra of HMT derivatives does not seem to differ sufficiently from the HMT bands to facilitate their in situ identification (Materese et al. 2020; Bera et al. 2019). To date these species have only been detected in the residues after ex situ analysis using GC–MS. Fortunately, the HMT bands in the IR allow its formation to be monitored, which is observed during the warming up of the previously irradiated ice. In UV irradiation experiments using the regular interstellar ice components, HMT formation mainly occurs near room temperature (Muñoz Caro & Schutte 2003; Vinogradoff et al. 2011; Vinogradoff et al. 2013), while the inclusion of methylamine (CH3NH2) in the irradiated ice lowers the HMT formation temperature to 230 K (Carrascosa et al. 2021). Therefore, as suggested by Materese et al. (2020), HMT derivatives likely form at relatively high temperatures similarly to HMT during the ice warm-up. Therefore, in line with these authors, it seems unlikely that it will produce an HMT-R derivative, thus replacing a H in one of the CH2 groups of the already-formed HMT, by the R functional group since this reaction would necessarily take place near room temperature. Instead, it is more plausible that the R group is inserted in an HMT precursor at a lower temperature while these groups were still present in the ice. In Sect. 3.3 we discuss the addition of R functional groups to HMT precursors by the insertion of other radicals or reactive neutral species in the reaction network that lead to HMT derivatives instead of HMT. In this context, the R groups in HMT-R derivatives may be considered as relics of the functional groups present in radicals or reactive neutral species that were produced during irradiation in the ice and made photoproducts of different volatility. Because HMT is refractory at room temperature, HMT-R derivatives offer a way to trace these R functional groups. Nevertheless, the relative abundance of these derivatives could not directly reflect that of the precursor radicals due to the influence of R-groups on HMT formation. Therefore, the presence of a derivative indicates the reactivity of the radical, but their relative abundances may not be quantitatively comparable. Table 1 shows among these groups that the radicals made by methanol photolysis (⋅CH2OH, ⋅CH3, ⋅CHO in aldehydes), water-methanol photolysis (OH), and ammonia photolysis (⋅NH2) are abundant. Other side groups could only be formed after reaction of radicals, ions, or neutral species in the ice, such as ⋅CH2NH2 (methylamine radical), ⋅CH2CH3 (ethyl radical), ⋅O-CH2CH3 (ethoxy radical), ⋅NCO (radical of isocyanic acid HNCO, OCN− is observed in the IR spectra of the irradiated ice mixtures), or -NH-CHO (formamide radical). Based on numerous publications, the formation of all these radicals in the ice and their important role in the synthesis of complex organic molecules could be expected. These side groups are easily recognisable in the list of molecules used to interpret the MS data measured in the nucleus of comet 67P by the COSAC-Rosetta instrument (Goesmann et al. 2015).
The detection of HMT in mid-IR spectra of interstellar and circumstellar ice mantles is unlikely because in the experiments the absorptions of this species and the HMT derivatives become evident after sublimation of the starting ice components. There is a much better chance to detect HMT and its derivatives in future cometary missions. Polyoxymethylene (POM) and related polymeric compounds are formed in water-poor ice mixtures containing CH3OH and NH3 (Schutte et al. 1993; Muñoz Caro & Schutte 2003), while HMT production is enhanced in more realistic ice analogues where these species are diluted in the water ice matrix (e.g. Muñoz Caro & Schutte (2003)). If present in comet 67P, POM and HMT are in extremely low abundance (Hänni et al. 2022), but HMT could still be present in other comets. The mass spectra we provide for the family of HMT derivatives in Table 1 were obtained by direct GC–MS analysis, without the need for derivatisation. These mass spectral data may thus serve for the identification of these compounds by in situ analysis of cometary matter.
Similar to comets, some carbon-rich meteorites known as carbonaceous chondrites, preserve pristine material formed in the local interstellar cloud and later in the solar nebula. As already mentioned, HMT has been identified in three carbonaceous chondrites; in addition, the HMT derivatives HMT-CH3, HMT-OH, and HMT-NH2 have been found in Murchison with relative-to-HMT abundances of 2, 0.2, and 0.03 , respectively, along with evidence for the presence of HMT-CH2OH or its isomers (Oba et al. 2020). These derivatives have also been identified in the reported experiments (see Table 1), where HMT-CH2OH is the most abundant derivative. As expected, its formation seems to be enhanced at higher methanol-to-ammonia ratios and a larger amount of methanol with respect to CO or CO2 as the C-source in the original ice (Briggs et al. (1992), Muñoz Caro & Schutte (2003), Muñoz Caro et al. (2004)). In comparison with our experiments, the lower abundance of HMT-CH2OH in Murchison suggests a methanol-to-ammonia ratio less than unity, or a smaller amount of methanol compared to other C-volatile reactants in the icy grains that agglomerated and evolved into the Murchison parent body.
Finally, we have observed that storage time is a relevant factor to consider in the detection of chemical species in the residues. Table 1 shows a decrease in the abundance of HMTCH3 between Exp. 4 (stored for 1 day) and Exp. 3 (stored for 3 days), even though both experiments started from the same initial composition of H2O:CH3OH:NH3. This suggests that the decrease in HMT-CH3 abundance could be related to longer storage time. However, a detailed analysis of this effect is beyond the scope of this article. The fact that this species is the most abundant HMT derivative in Murchison (Oba et al. 2020) is probably due to the overall composition of the meteorite differing from that of the residues, the former being more refractory than the latter, since the fraction of organic molecules in Murchison is relatively low. As a result, the sublimation of HMT derivatives is hindered by the meteorite matrix, and can be retained for very long periods of time.
Acknowledgements
This research was funded by projects PID2020-118974GB-C21 and PID2023-151513NB-C21 by the Spanish Ministry of Science and Innovation, and the National Science and Technology Council, Taiwan, under grant no. NSTC 110-2628-M-008-004-MY4 (Y.-J.C.). C.B. was supported by an INTA grant.
References
- Allamandola, L., Sandford, S., & Valero, G., 1988, Icarus, 76, 225 [Google Scholar]
- Bera, P. P., Sandford, S. A., Lee, T. J., & Nuevo, M., 2019, ApJ, 884, 64 [Google Scholar]
- Bernstein, M. P., Sandford, S. A., Allamandola, L. J., Chang, S., & Scharberg, M. A., 1995, ApJ, 454, 327 [NASA ADS] [CrossRef] [Google Scholar]
- Briggs, R., Ertem, G., Ferris, J. P., et al. 1992, Origins Life Evol. Biosphere, 22, 287 [NASA ADS] [CrossRef] [Google Scholar]
- Canta, A., Öberg, K. I., & Rajappan, M., 2023, ApJ, 953, 81 [NASA ADS] [CrossRef] [Google Scholar]
- Carrascosa, H., González Díaz, C., Muñoz Caro, G. M., Gómez, P. C., & Sanz, M. L. 2021, MNRAS, 506, 791 [NASA ADS] [CrossRef] [Google Scholar]
- Cottin, H., Szopa, C., & Moore, M. H., 2001, ApJ, 561, L139 [NASA ADS] [CrossRef] [Google Scholar]
- Danger, G., Orthous-Daunay, F. R., de Marcellus, P., et al. 2013, Geochim. Cosmochim. Acta, 118, 184 [NASA ADS] [CrossRef] [Google Scholar]
- Goesmann, F., Rosenbauer, H., Bredehöft, J. H., et al. 2015, Science, 349, aab0689 [CrossRef] [Google Scholar]
- Hänni, N., Altwegg, K., Combi, M., et al. 2022, Nat. Commun., 13, 3639 [CrossRef] [Google Scholar]
- Kaliszan, R., 1992, Analyt. Chem., 64, 619A [Google Scholar]
- Marks, J. H., Wang, J., Kleimeier, N. F., et al. 2023, Angew. Chem. Int. Ed., 62, e202218645 [Google Scholar]
- Martín-Doménech, R., Öberg, K. I., & Rajappan, M., 2020, ApJ, 894, 98 [Google Scholar]
- Materese, C. K., Nuevo, M., Sandford, S. A., Bera, P. P., & Lee, T. J., 2020, Astrobiology, 20, 601 [Google Scholar]
- McGuire, B. A., 2022, ApJSS, 259, 30 [NASA ADS] [CrossRef] [Google Scholar]
- Meierhenrich, U. J., Muñoz Caro, G. M., Schutte, W. A., et al. 2005, Chemistry, 11, 4895 [Google Scholar]
- Meissner, F., Schwiedessen, E., & Othmer, D. F., 1954, Ind. Eng. Chem., 46, 724 [Google Scholar]
- Muñoz Caro, G. M., & Schutte, W. A., 2003, A&A, 412, 121 [NASA ADS] [CrossRef] [EDP Sciences] [Google Scholar]
- Muñoz Caro, G. M., Meierhenrich, U., Schutte, W. A., Thiemann, W. H. P., & Greenberg, J. M., 2004, A&A, 413, 209 [NASA ADS] [CrossRef] [EDP Sciences] [Google Scholar]
- Muñoz Caro, G. M., Carrascosa, H., & Martín Doménech, R., 2025, Nat. Rev. Chem., in press [Google Scholar]
- Oba, Y., Takano, Y., Naraoka, H., et al. 2020, Nat. Commun., 11, 6243 [Google Scholar]
- Qasim, D., Fedoseev, G., Chuang, K.-J., et al. 2019, A&A, 627, A1 [NASA ADS] [CrossRef] [EDP Sciences] [Google Scholar]
- Schutte, W. A., Allamandola, L. J., & Sandford, S. A., 1993, Science, 259, 1143 [Google Scholar]
- Urso, R. G., Vuitton, V., Danger, G., et al. 2020, A&A, 644, A115 [NASA ADS] [CrossRef] [EDP Sciences] [Google Scholar]
- Vinogradoff, V., Duvernay, F., Danger, G., Theulé, P., & Chiavassa, T., 2011, A&A, 530, A128 [NASA ADS] [CrossRef] [EDP Sciences] [Google Scholar]
- Vinogradoff, V., Rimola, A., Duvernay, F., et al. 2012, Phys. Chem. Chem. Phys., 14, 12309 [NASA ADS] [CrossRef] [Google Scholar]
- Vinogradoff, V., Fray, N., Duvernay, F., et al. 2013, A&A, 551, A128 [NASA ADS] [CrossRef] [EDP Sciences] [Google Scholar]
All Tables
Summary of HMT derivatives detected by GC–MS with their corresponding retention time and molecular ion detected.
All Figures
|
Fig. 1 Top IR spectrum: residue of Exp. 2 at the moment of removal from high vacuum chamber. Middle IR spectrum: Residue of Exp. 2 after 5 days in storage under N2 atmosphere at 20∘C. The bands related to HMT diminish with storage time, pointing out the importance of the analysis time, as well as storage conditions. Bottom IR spectrum: HMT standard (Sigma-Aldrich 99%). |
| In the text | |
|
Fig. 2 Gas chromatograms of the residues produced by irradiation of H2O:CH3OH:NH3 (100:50:100) ices at 84 K , followed by warming to 300 K. The residue from Exp. 3 was stored for 60 h in MOSS (P = 10−7 mbar) until analysis by GC–MS, while that from Exp. 4 was stored for 9 h. |
| In the text | |
|
Fig. 3 Mass spectra and molecular structures corresponding to the compounds detected in our experiments and listed in Table 1 from Nos. 1 to 9, arranged according to their retention times. |
| In the text | |
|
Fig. 4 Mass spectra and molecular structures corresponding to the compounds detected in our experiments and listed in Table 1 from Nos. 10 to 18 , arranged according to their retention times. |
| In the text | |
|
Fig. 5 m/z = 111+R fragment in the mass spectra of HMT-R-H derivatives suggests a fragmentation mechanism involving the loss of one of the CH2N groups (highlighted in blue) upon ionisation in the filament of the QMS adjacent to the CH-R-H group (where R-H represents the characteristic side group of each HMT derivative, e.g. CH3, NH2, OH, and CHO), giving rise to fragments with a mass of 111 + R g/mol. |
| In the text | |
|
Fig. 6 m/z = 41+R fragment in the mass spectra of HMT-R derivatives suggests the loss of a N-CH(R)-N or R-CH-N-CH2 fragment (marked) upon ionisation in the filament of the QMS. In an HMT-R molecule there are four cleavages generating the R-CH-N-CH2 fragment (marked in blue) and one generating the N-CH(R)-N fragment (marked in red). |
| In the text | |
|
Fig. 7 Proposed mechanism for the formation of HMT-CH3 from the commonly accepted formation mechanism of HMT (Meissner et al. 1954; Carrascosa et al. 2021). The substitution of a methyleneimine molecule by an ethanimine (CH3CH=NH) leads to the formation of TMT- CH3. The methyl group remains in the HMT structure, finally forming HMT-CH3. |
| In the text | |
|
Fig. 8 Mechanism of HMT formation, where the hydrogens of the HMT precursors are susceptible to R-group substitution to form HMT-R. |
| In the text | |
Current usage metrics show cumulative count of Article Views (full-text article views including HTML views, PDF and ePub downloads, according to the available data) and Abstracts Views on Vision4Press platform.
Data correspond to usage on the plateform after 2015. The current usage metrics is available 48-96 hours after online publication and is updated daily on week days.
Initial download of the metrics may take a while.