Fig. 2
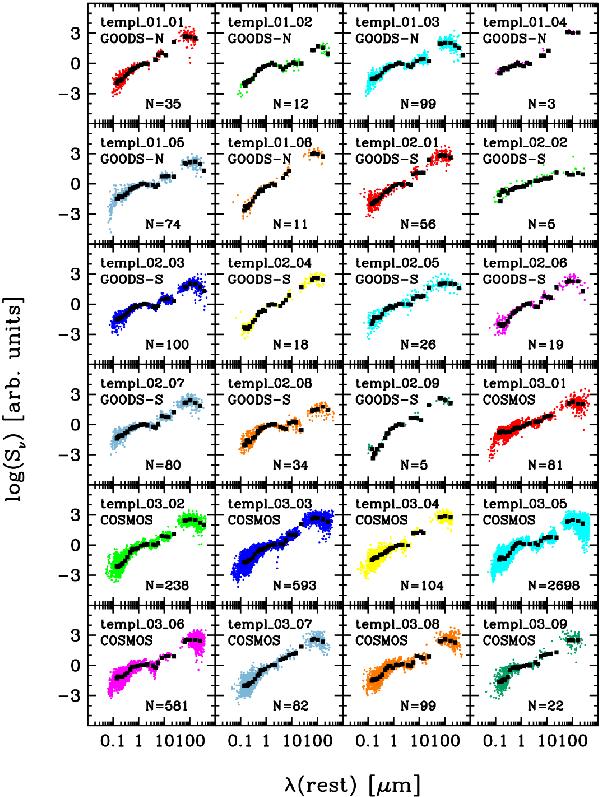
Rest-frame spectral energy distributions of the Gaussian modes found in the three fields. Black squares represent median SEDs obtained through restframe filters (see Table 2). Colored dots trace the de-redshifted photometry of individual sources. The number of objects contributing to each group is quoted in the respective panel.
Current usage metrics show cumulative count of Article Views (full-text article views including HTML views, PDF and ePub downloads, according to the available data) and Abstracts Views on Vision4Press platform.
Data correspond to usage on the plateform after 2015. The current usage metrics is available 48-96 hours after online publication and is updated daily on week days.
Initial download of the metrics may take a while.