| Issue |
A&A
Volume 551, March 2013
|
|
|---|---|---|
| Article Number | A100 | |
| Number of page(s) | 22 | |
| Section | Extragalactic astronomy | |
| DOI | https://doi.org/10.1051/0004-6361/201220859 | |
| Published online | 01 March 2013 | |
Online material
Appendix A: Results of SED fitting
In this Appendix, the results of SED fitting are presented. For each median SED or outlier, only the best fit solution is shown, either with or without the AGN component added.
We recall (see Sect. 4) that the magphys code (da Cunha et al. 2008) was adopted to reproduce SEDs. It combines BC03 optical/NIR stellar models, including the effects of dust attenuation as prescribed by Charlot & Fall (2000), to MIR/FIR dust emission computed as in da Cunha et al. (2008), linking the two components through energy balance: the total energy absorbed by dust in stellar birth clouds and in the ambient interstellar medium is re-distributed at infrared wavelengths.
The code has then been modified to include the possible contribution of an AGN torus component, using the Fritz et al. (2006) library, in order to overcome one of magphys main assumptions, implying that the only source of dust heating is starlight.
Figure A.1 shows our best fit solutions (i.e. those with minimum χ2). Table A.1 summarizes results, including a brief description of each template, restframe colors spanning from the u band to 160 μm, and AGN contribution to the infrared (8−1000 μm) luminosity. The latter is reported only for objects that require an AGN component, while sources best reproduced by the original magphys code have a L(IR) AGN fraction <1%.
Restframe colors have been obtained by convolving best fit models with filter transmission curves. Descriptions provided in Table A.1 highlight the main features of templates, e.g. optical colors (red/blue), position of the FIR peak (warm/cold), intensity of PAH emission, optical extinction, AGN contribution, as well as additional known properties of individual outliers. Type-1 and Type-2 AGN labels refer simply to the best fit solution and are defined such that in “type-2” models the line of sight intersects the torus dust distribution (Φ > 90°−Θ/2, with Φ defined starting from the polar axis, see Fritz et al. 2006), and vice versa in “type-1” cases.
Description of new templates, including colors [mag] in the optical to FIR wavelength range and the contribution of a possible AGN to the 8–1000 μm luminosity.
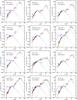 |
Fig. A.1
Best fit to median SEDs, as obtained either with the magphys code (da Cunha et al. 2008) or with the modified version including a torus component (using the Fritz et al. 2006 library). Blue dotted lines represent the un-absorbed stellar component, while red dashed lines trace the combination of extinguished stars and dust infrared emission. The torus component is depicted with long-dashed green lines, and black solid lines are the total emission, in those cases for which an AGN is needed. |
| Open with DEXTER | |
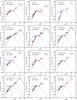 |
Fig. A.1
continued. |
| Open with DEXTER | |
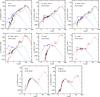 |
Fig. A.1
continued. |
| Open with DEXTER | |
© ESO, 2013
Current usage metrics show cumulative count of Article Views (full-text article views including HTML views, PDF and ePub downloads, according to the available data) and Abstracts Views on Vision4Press platform.
Data correspond to usage on the plateform after 2015. The current usage metrics is available 48-96 hours after online publication and is updated daily on week days.
Initial download of the metrics may take a while.