| Issue |
A&A
Volume 551, March 2013
|
|
|---|---|---|
| Article Number | A126 | |
| Number of page(s) | 9 | |
| Section | Planets and planetary systems | |
| DOI | https://doi.org/10.1051/0004-6361/201220857 | |
| Published online | 05 March 2013 | |
The D/H ratio in the atmospheres of Uranus and Neptune from Herschel-PACS observations⋆
1
Max-Planck-Institut für extraterrestrische Physik,
Giessenbachstraße, 85748
Garching, Germany
e-mail: This email address is being protected from spambots. You need JavaScript enabled to view it.
2
LESIA, Observatoire de Paris, 5 place Jules Janssen, 92195
Meudon,
France
3
Jet Propulsion Laboratory, California Institute of
Technology, 4800 Oak Grove
Dr., Pasadena,
CA
91109,
USA
4
ALMA Observatory, Alonso de Cordova 3107, Vitacura, Santiago, Chile
5
Instituut voor Sterrenkunde, Katholieke Universiteit
Leuven, Celestijnenlaan
200D, 3001
Leuven,
Belgium
6
Rutherford Appleton Laboratory, Oxfordshire, UK
7
University College London, Gower Street, London
WC1E 6BT,
UK
8
Max-Planck-Institut for Solar System Research,
37191
Katlenburg-Lindau,
Germany
9
Univ. Bordeaux, LAB, UMR 5804, 33270, Floirac, France
10
CNRS, LAB, UMR 5804, 33270, Floirac, France
Received:
6
December
2012
Accepted:
23
January
2013
Abstract
Herschel-PACS measurements of the rotational R(0) and R(1) HD lines in the atmospheres of Uranus and Neptune are analyzed to derive a D/H ratio with improved precision for the two planets. The derivation of the D/H ratio also includes previous measurements of the R(2) line with the Short Wavelength Spectrometer on board the Infrared Space Observatory (ISO). The available spectroscopic line information of the three rotational transitions is discussed and applied in the radiative transfer calculations. The best simultaneous fit of all three lines requires only a minor departure from the Spitzer temperature profile of Uranus and a departure limited to 2K from the Voyager temperature profile of Neptune (each time around the tropopause). The resulting and remarkably similar D/H ratios for Uranus and Neptune are found to be (4.4 ± 0.4) × 10-5 and (4.1 ± 0.4) × 10-5, respectively. Although the deuterium enrichment in the two atmospheres compared to the protosolar value is confirmed, it is found to be lower compared to previous analyses. Using interior models from the literature and assuming that complete mixing of the atmosphere and interior occured during the planets’ history, we derive a D/H in protoplanetary ices between (5.75–7.0) × 10-5 for Uranus and between (5.1–7.7) × 10-5 for Neptune. Conversely, adopting a cometary D/H for the protoplanetary ices between (15–30) × 10-5, we constrain the interior models of the two planets to have an ice mass fraction of 14–32%, i.e., the two planets are rock-dominated.
Key words: planets and satellites: interiors / planets and satellites: individual: Uranus / planets and satellites: atmospheres / planets and satellites: individual: Neptune
Herschel is an ESA space observatory with science instruments provided by European-led Principal Investigator consortia and with important participation from NASA.
© ESO, 2013
1. Introduction
Among the light nuclides synthesized during the early evolution of the universe, deuterium is unique in its sensitivity to determine the cosmological density of baryons. As early as in the pre-main sequence of stars, deuterium was burned up to 3He. The gas that returns into the interstellar matter by stellar outflows and supernova explosions is then free of deuterium. On the other hand, no process is known to produce deuterium, therefore its abundance is decreasing with time, particularly with progressing star formation. The deuterium abundance as measured today thus provides a lower limit for its corresponding primordial value. The determination of accurate D/H ratios in the atmospheres of the giant planets has therefore been a longstanding target of research, because these ratios enable constraining the D/H ratio in the part of our Galaxy where the solar system formed. Moreover, the D/H ratio is known to increase in icy grains with decreasing temperature due to ion-molecule and grain-surface interactions (Watson 1974; Brown & Millar 1989). Measuring the D/H ratio as a function of heliocentric distance in the solar system therefore enables probing the formation temperature of icy grains in the protoplanetary disk (Owen et al. 1999; Hersant et al. 2001; Gautier & Hersant 2005), since the D/H value measured in the atmospheric gas can be linked to the D/H value in the protoplanetary ices, as we show in Sect. 5.
The D/H ratio in the hydrogen of the atmospheres of Jupiter and Saturn is believed to be very close to the protosolar value, because the mass of their cores is negligible with respect to their total mass and because H2 is by far the main constituent of their atmospheres. Consequently, deuterium enrichment of the hydrogen reservoir through ices played only a minor role during their formation. However, the atmospheres of Uranus and Neptune are expected to have atmospheres enriched in deuterium. According to Guillot (1999), their cores (which in the models are composed of 25% rock and 60–70% ice) make up for more than half of the total mass and mixing of deuterium-enriched icy grains and planetesimals with the hydrogen envelope during their formation (Hubbard & McFarlane 1980) must have led to a substantially higher D/H ratio in their atmospheres as compared to the protosolar value.
Molecular hydrogen represents the major fraction of the atmospheres of the giant planets (~85%). Therefore it is particularly well suited to determine the deuterium abundance from the HD/H2 ratio. A number of deuterium abundance determinations from infrared observations of CH3D have been reported for Uranus and Neptune (de Bergh et al. 1986, 1990; Orton et al. 1992; Fletcher et al. 2010; Irwin et al. 2012), but the knowledge of the required isotopic enrichment factor f =(D/H)CH4/(D/H)H2, is uncertain (Lécluse et al. 1996). Direct observations of rotational far-infrared HD transitions by ground-based observatories are difficult because of the opacity of the Earth’s atmosphere in the relevant wavelength regions. Optical detections of HD have been reported by Trauger et al. (1973) on Jupiter and by Smith et al. (1989a) on Saturn. Similar measurements of HD at visible wavelengths, reported for Uranus (Trafton & Ramsay 1980), suffer from low signal-to-noise ratio and blending with weak CH4 lines, so they can provide only upper limits for Uranus and Neptune (Smith et al. 1989b). On the other hand, space-based observatories such as ISO (Kessler et al. 1996) and Herschel (Pilbratt et al. 2010) have access to the mid- to far-infrared rotational (R-branch) lines of HD (Ulivi et al. 1991, see also Table 2). While the Voyager/IRIS instrument could not detect these lines because of its insufficient spectral resolution, observations by the medium-to-high resolution spectrometers ISO-SWS (de Graauw et al. 1996) and ISO-LWS (Clegg et al. 1996) resulted in D/H values with significantly improved precision for all four giant planets (Griffin et al. 1996; Encrenaz et al. 1996; Feuchtgruber et al. 1999; Lellouch et al. 2001). The baseline spectral response calibration of the ISO-LWS instrument was obtained from Uranus observations. Consequently, this fact prevented a quantitative analysis of the HD R(0) 112 μm and HD R(1) 57 μm lines for Uranus and Neptune. An analysis of ISO-LWS measurements of Mars and Callisto gave only inconsistent results (Davies et al. 2000), i.e., a line detection at low signal-to-noise with a relative spectral response derived from Callisto and a non-detection at high signal-to-noise with a relative spectral response derived from Mars.
The Herschel-PACS instrument is therefore the first astronomical facility that allows access to the information provided by these two lines with high signal-to-noise ratio.
One major goal of the Herschel key program HssO (“Water and Related Chemistry in the Solar system”, Hartogh et al. 2009) was indeed to observe HD lines in the four giant planet atmospheres and improve the uncertainties of their respective D/H ratios. First results from HD observations on Neptune by the far-infrared spectrometer PACS (Poglitsch et al. 2010) on board Herschel have been presented in Lellouch et al. (2010). In this work we present a combined analysis of the three rotational far-infrared lines of HD detected with ISO-SWS (HD R(2)) and Herschel-PACS (HD R(0) & HD R(1)) towards a more accurate D/H ratio in the atmospheres of Uranus and Neptune.
Summary of PACS observations.
2. Observations and data reduction
PACS spectrometer observations of the HD R(0) and R(1) lines on Uranus and Neptune have been performed in the high spectral sampling density chop-nod mode of the instrument (Poglitsch et al. 2010). The details of the observations are summarized in Table 1. The spectrometer spectral resolution λ/δλ at the two HD line wavelengths of 56.23 μm and 112.07 μm is about 2500 and 950, respectively. Each of the lines has been measured both in range-scan mode (covering broad wavelength ranges) and in line-scan mode (short wavelength interval centered on the line). Several additional shallow grating scans covering the full PACS wavelength range have been carried out on both planets as part of the PACS instrument calibration program on their continua, but these measurements did not reach sufficient signal-to-noise ratios on the two HD lines and are not included here. As part of the Herschel open time (OT) program “Variability in Ice Giant Stratospheres: Implications for Radiative, Chemical and Dynamical Processes” led by G. Orton (OT1_gorton01_1 program), a number of observations of the HD R(0) and HD R(1) lines have been taken at different longitudes. The HD R(1) line was part of the observing program on Uranus, but not on Neptune. Fortunately, this line is seen in the blue spectrometer channel simultaneously to the red channel R(0) line observations on Neptune, but only in grating order 2, at an accordingly lower spectral resolution of 1400. These data are included here as well, which allows us to significantly improve the statistics and to assess the observational reproducibility. The data were extracted from the Herschel science archive and processed up to Level 1 within HIPE 8.0 (see Poglitsch et al. 2010). We rebinned and combined the two nod positions outside HIPE with standard IDL tools. The absolute calibration uncertainty of the PACS spectrometer data is about 30% (Poglitsch et al. 2010). For an accurate determination of the D/H ratio, all spectra were divided by their local continua. Thus, absolute calibration errors cancel out and the uncertainties on the line contrast are only driven by the signal-to-noise ratio of the observations. Although the wavelength scale of the observations was corrected by the Herschel-target velocity Doppler shift, residual line center shifts remain. The size of the spatial PACS spectrometer pixels is about 9.4′′ × 9.4′′ and the width of the Herschel telescope point spread function (PSF) ranges from about 6′′ to 15′′ within the PACS wavelength range. Consequently, Uranus and Neptune are considered to be point sources in the context of these observations. The nominal spacecraft pointing uncertainty can move point sources at significantly different positions within the PACS spectrometer slit. As a result, the wavelengths of the spectra may appear to be slightly shifted, since the nominal calibration applies to the slit center or for extended sources only (Poglitsch et al. 2010). Therefore, to prepare for a best-fit analysis, the spectra of all lines were recentered onto their rest wavelengths.
Adopted HD line parameters for Uranus and Neptune.
Longwards of the R(1) line, around 56.325 μm, a strong stratospheric H2O emission line is detected. It is not included in this model, however, because it is inconsequential for the D/H determination.
The ISO-SWS observations of the HD R(2) line at 37.7 μm were carried out in 1996–1997 on the two planets at a spectral resolution of 1700. Together with the HD line, the quadrupolar rotational lines of H2, S(0) at 28.22 μm and S(1) at 17.03 μm were measured to obtain independent constraints for the thermal profile modeling at similar atmospheric pressure levels. Observational details, data reduction, and modeling of the HD R(2) line on the two planets are described in Feuchtgruber et al. (1999). To facilitate a common modeling scheme with respect to the PACS spectra, these data were also divided by the continuum.
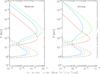 |
Fig. 1 Monochromatic contribution function for the three HD lines (red: R(0); green: R(1); blue: R(2)). Solid: line core; dashed: continuum. |
3. HD line parameters
The available information on spectroscopic HD line parameters from the literature was
revisited and a few significant updates with respect to the line parameters used by
Feuchtgruber et al. (1999) and Lellouch et al. (2010) were worked out. Accurate measurements of the
wavelengths of the pure rotational transitions of HD are taken from Evenson et al. (1988) and Ulivi et al. (1991) and remain unchanged. The dipole moment μ of HD is taken
now from Table 2 of Lu et al. (1993) as a mean value
across the four measured rotational transitions R(0) to R(3). This value of
μ = 8.21 Debye is then translated into the spectral line intensities
given in Table 2. A 1σ uncertainty
of ~3% on the resulting spectral line intensity values is estimated from the scatter in
reported dipole moments. Line broadening coefficients γ have been measured
by Lu et al. (1993) at three different temperatures
compared to 295 K only by Drakopoulos & Tabisz (1987a) and Drakopoulos & Tabisz (1987b). The coefficient n that describes the temperature
dependence of the half width at half maximum γ was fit to the measured
values by  Within
the temperature range of ~50–120 K, containing the dominating contributions for HD line
modeling in the atmospheres of Uranus and Neptune, the errors of this fit are ≤0.5% with
respect to a linear interpolation of the measurements. For the line parameters
γ, n, and the wavenumber shift coefficient δ of the four
transitions, the contributions from the two most significant collisions HD-H2 and
HD-He were weighted according to the relative abundance of H2 and He in the
atmospheres of the outer planets (0.85/0.15). Updated rotational constants for the HD
molecule were taken from Ulivi et al. (1991) and were
included in the code of Ramanlal & Tennyson (2004) to calculate the temperature dependence of the partition function. The
entire set of HD line parameters used in the modeling is given in Table 2. The respective values for the R(3) transition that are
not part of this analysis are provided for completeness.
Within
the temperature range of ~50–120 K, containing the dominating contributions for HD line
modeling in the atmospheres of Uranus and Neptune, the errors of this fit are ≤0.5% with
respect to a linear interpolation of the measurements. For the line parameters
γ, n, and the wavenumber shift coefficient δ of the four
transitions, the contributions from the two most significant collisions HD-H2 and
HD-He were weighted according to the relative abundance of H2 and He in the
atmospheres of the outer planets (0.85/0.15). Updated rotational constants for the HD
molecule were taken from Ulivi et al. (1991) and were
included in the code of Ramanlal & Tennyson (2004) to calculate the temperature dependence of the partition function. The
entire set of HD line parameters used in the modeling is given in Table 2. The respective values for the R(3) transition that are
not part of this analysis are provided for completeness.
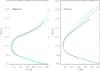 |
Fig. 2 Thermal (p,T) profiles for the two planets. Neptune: dark blue = baseline profile (Bézard et al. 1991); green = Feuchtgruber et al. (1999); light blue = Lellouch et al. (2010); red = best-fit profile to the three HD lines; Uranus: blue = baseline profile (Orton et al. 2013); green = Feuchtgruber et al. (1999); red = best-fit profile to the three HD lines; light blue = best fit to R(0) and R(1) lines only. |
4. Analysis of the D/H ratio
The observations were analyzed by means of a multilayer radiative-transfer model in which the HD/H2 mixing ratio is assumed to be uniform with altitude. The model includes atmospheric opacities of the three measured HD lines (see Table 2) and collision-induced absorption of H2-H2 (Borysow et al. 1985), H2-He (Borysow et al. 1988), H2-CH4 (Borysow & Frommhold 1986) and CH4-CH4 (Borysow & Frommhold 1987). Orton et al. (2007) updated the H2-H2 coefficients of Borysow et al. (1985), but the modifications to far-infrared absorption were insignificant.
The synthetic spectra were calculated monochromatically, integrated over all viewing angles of the planets, and then convolved with the instrumental profile (FWHM = 120, 215, 315 km s-1) at the respective wavelengths and grating orders. Monochromatic contribution functions for the line centers and their adjacent continua (Fig. 1) indicate the range of layers within the thermal profile dominating the continuum divided spectra of the two planets. The line-to-continuum ratios of the ensemble of the three HD lines are sensitive to atmospheric pressure levels from ~10-4 bar to ~1.5 bar. An initial thermal profile (p,T) of Uranus was taken from Orton et al. (2013), representing a best fit to CH4 and CH3D emission spectra from Spitzer IRS data. The initial profile for Neptune was taken from Bézard et al. (1991), whose tropospheric part relevant for this work originates from the Voyager radio occultation experiment (Lindal et al. 1990). These baseline profiles for the two planets do not allow one to obtain a good match of all three observed HD lines with the model. Together with the HD/H2 mixing ratio, these thermal profiles are adjusted by a fourth order polynomial (in log(p)) minimizing the least squares to fit all continuum-divided spectra of the three HD transitions simultaneously by the model. Figure 2 shows the best-fit thermal profile for the two planets, together with the initial input profiles and earlier work for comparison. Combining the Herschel data of the HD lines with Spitzer data for a joint modeling is deferred to the future.
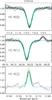 |
Fig. 3 Observed and synthetic Uranus spectra. Black: continuum-divided spectra (solid: range scan; dashed: HssO line scan; dotted: OT line scans) and best-fit model (red) with D/H = 4.41 × 10⁻⁵. Synthetic spectra for different D/H ratios but for the same thermal profile to illustrate the sensitivity to this model parameter are shown as green solid lines for D/H = 3.4 × 10⁻⁵ and D/H = 5.4 × 10⁻⁵ (3σ) and blue solid lines for D/H = 4.07 × 10⁻⁵ and D/H = 4.75 × 10⁻⁵ (1σ). The spectral line around 56.33 μm is caused by stratospheric H2O emission and is not included in the model. The R(2) line has been measured by ISO-SWS. |
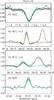 |
Fig. 4 Observed and synthetic Neptune spectra. Black: continuum-divided spectra (solid: range scan; dashed: GT line scan; dotted: OT line scans) and best-fit model (red) with D/H = 4.08 × 10⁻⁵. Synthetic spectra for different D/H ratios but for the same thermal profile to illustrate the sensitivity to this model parameter are shown as green solid lines for D/H = 3.09 × 10⁻⁵ and D/H = 5.07 × 10⁻⁵ (3σ) and blue solid lines for D/H = 3.75 × 10⁻⁵ and D/ H = 4.41 × 10⁻⁵ (1σ). The R(1) line has been observed in two different grating orders (n) and accordingly at different instrumental resolution. The strong spectral line around 56.33 μm is caused by stratospheric H2O emission and is not included in the model. The R(2) line has been measured by ISO-SWS. |
For Uranus, the resulting profile agrees remarkably well with Feuchtgruber et al. (1999) and Orton et al. (2013) for pressures ≥200 mbar. The profile of Feuchtgruber et al. (1999) is about 5 K colder at 70 mbar, 5 K warmer at 10 mbar, and about 15 K colder for pressures lower than 1 mbar than our best fit profile. With respect to Orton et al. (2013), the new profile is slightly warmer (up to 2 K) between 100 mbar and 5 mbar, but for lower pressures the new profile becomes continuously warmer up to 10 K at 0.1 mbar. For Neptune, the baseline profiles from Bézard et al. (1991) and Lindal et al. (1990) required a slight cooling of 1–2 K starting at 5 mbar towards higher pressure levels. At lower pressures, the differences become negligible. The profile of Lellouch et al. (2010) is warmer at all levels, from about 2 K at 1 bar to 4 K at the tropopause up to around 10 K at 1 mbar.
For Neptune, the sub-Earth latitude changed only from about –27.3° to –28.3° between 1996 and 2010, justifying the approach of combining the ISO-SWS data with Herschel-PACS data for a joint modeling by one thermal profile. However, the change of sub-Earth latitude for Uranus went from –46.6° in 1996 to +13.5° in 2010. VLA mapping observations of Uranus at centimeter wavelengths are reported by Hofstadter & Butler (2003) and Hofstadter et al. (2011), which indicate spatial changes to the thermal profile at pressures ≥1 bar within the period of interest. To verify whether a possible change in the disk-averaged thermal profile between the epochs of the ISO-SWS and PACS observations may affect our analysis on Uranus, we also derived a thermal profile by a best fit to the R(0) and R(1) lines only. The respective D/H ratio for fitting only these two lines is slightly higher (4.7 × 10⁻⁵) but still within the 1σ uncertainty, but for this thermal profile the model overpredicts the R(2) line already by 30%. The resulting profile (see Fig. 2) is essentially the same for pressures higher than 100 mbar compared to the profile derived from all three lines. Small departures (≤2 K) occur only at lower pressures, confirming that our analysis is not affected by seasonal changes when all three lines are included in the calculations.
Figures 3 and 4 show all observed spectra and the calculated models for Uranus and Neptune. The peak-to-peak scatter in the line-to-continuum ratios between different PACS observations is about 19% (14 observations) and 17% (10 observations) for the R(0) transitions on Uranus and Neptune. However, this scatter is mainly due to variations in spacecraft pointing offsets, which may cause slight instrumental profile variations and therefore variations of the peak contrast. A variation of the best-fit D/H ratios by ~± 1 × 10⁻⁵ using the same thermal profiles matches the extremes within the R(0) and R(1) observations well. However, at the same time, variations by this amount appear to be incompatible with the measured spectra of the R(2) lines. The D/H ratio that matches the extremes within all observations of the R(0) and R(1) lines can be considered as the 3σ statistical error. Translated to 1σ uncertainties we obtain D/H = (4.41 ± 0.34) × 10-5 for Uranus and D/H = (4.08 ± 0.33) × 10-5 for Neptune.
However, on top of the statistical error from the number of independent observations, there are also systematic uncertainties on the spectroscopic line parameters of HD. Line intensities (3%, 1σ), broadening parameter and its temperature coefficient, and the wavenumber-shift parameter have independent and transition-specific uncertainties of a few percent, which may affect the calculations of the D/H ratio either way. We therefore add a 5% uncertainty in quadrature to our statistical error and finally quote D/H = (4.4 ± 0.4) × 10-5 for Uranus and D/H = (4.1 ± 0.4) × 10-5 for Neptune. Note finally that some warming or cooling of the best-fit thermal profiles by ±1 K leads to synthetic spectra that depart by ~1σ for all observed lines on Uranus and slightly more than 1σ for the R(0), R(2), and about 2σ for the R(1) measurements on Neptune. Therefore, error bars due to thermal-profile uncertainties can be neglected compared to those due to the scatter in observed line contrasts.
These D/H ratio values can be compared to results on the deuterium content in the methane
reservoirs of the two planets. Using the isotopic enrichment factors from Lécluse et al.
(1996) of f = 1.68 ± 0.23 for
Uranus and f = 1.61 ± 0.21 for Neptune with
 and
and
 we
obtain CH3D/CH4 (Uranus
we
obtain CH3D/CH4 (Uranus and CH3D/CH4 (Neptune
 ,
which agrees well with recent results by Irwin et al. (2012) (CH3D/CH
,
which agrees well with recent results by Irwin et al. (2012) (CH3D/CH for Uranus) and Fletcher et al. (2010)
(CH3D/CH
for Uranus) and Fletcher et al. (2010)
(CH3D/CH for Neptune).
5. Discussion
Our new measurement of the D/H ratio in H2 in Uranus and Neptune can be combined
with a model of their internal structure to constrain the D/H ratio in their protoplanetary
ices. Following the approach proposed by Lécluse et al. (1996) that was also adopted by Feuchtgruber et al. (1999), (D/H)ices can be expressed as
 where
(D/H)planet is the bulk D/H ratio in the planet, taken to be equal to its value
in the fluid envelope (D/H)envelope. This assumes that the atmosphere and
interior of the planet have been fully mixed, i.e. that high-temperature equilibration of
deuterium between hydrogen and ices has occurred during the planet’s history. This
assumption of global mixing is central to our analysis. Formation models (Pollack &
Bodenheimer 1989) suggest that the planetary
envelopes mixed in early stages, but whether this was true also for core material is
admittedly unknown. Current giant planets may not be fully convective, especially Uranus
(see Podolak et al. 1995; Guillot 2005), and it is not known whether this state is
primordial or not. Another assumption of the model is that (D/H)envelope is equal
to the D/H ratio value we determined in H2. This assumes that the atmospheric
deuterium content is largely dominated by H2, with negligible contribution from
heavy H-bearing species (e.g. H2O). This hypothesis is discussed below in more
detail.
where
(D/H)planet is the bulk D/H ratio in the planet, taken to be equal to its value
in the fluid envelope (D/H)envelope. This assumes that the atmosphere and
interior of the planet have been fully mixed, i.e. that high-temperature equilibration of
deuterium between hydrogen and ices has occurred during the planet’s history. This
assumption of global mixing is central to our analysis. Formation models (Pollack &
Bodenheimer 1989) suggest that the planetary
envelopes mixed in early stages, but whether this was true also for core material is
admittedly unknown. Current giant planets may not be fully convective, especially Uranus
(see Podolak et al. 1995; Guillot 2005), and it is not known whether this state is
primordial or not. Another assumption of the model is that (D/H)envelope is equal
to the D/H ratio value we determined in H2. This assumes that the atmospheric
deuterium content is largely dominated by H2, with negligible contribution from
heavy H-bearing species (e.g. H2O). This hypothesis is discussed below in more
detail.
For the protosolar D/H ratio value, we adopted
(D/H)proto = (2.25 ± 0.35) × 10-5, based on the analysis of ISO-SWS
measurements on Jupiter (Lellouch et al. 2001). For
the volumetric ratio
xH2 = nH2 / (nH2 + nH2O)
of H2, we initially used the interior models of Podolak et al. (1995). For Neptune, Podolak et al. (1995) considered two model variants, one with a “canonical” density in
the ice shell, and one with a density reduced by 20%. These models provide values (expressed
in Earth masses) for the gas (MH2 + He), ice
(Mice), and rock (Mrock)
components of the planet. Note that all the Podolak et al. (1995) models assumed a solar rock-to-ice ratio (~2.5), i.e., an ice-mass ratio in
the heavy element component
(F = Mice / (Mice + Mrock))
equal to 0.715. Assuming solar composition, i.e., H2/(H2 + He) = 0.747
by mass (consistent with Helled et al. 2011),
xH2 can be expressed as
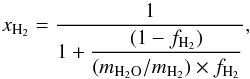 where
where
 is
the mass ratio of H2 and mH2O and
mH2 are the molar masses of H2O and
H2 (i.e., 18 g and 2 g). The xH2 values
and the inferred (D/H)ices are given in Table 3 (note that the xH2 values are slightly
different from those given in Feuchtgruber et al. (1999) because there was a minor mistake in that paper).
is
the mass ratio of H2 and mH2O and
mH2 are the molar masses of H2O and
H2 (i.e., 18 g and 2 g). The xH2 values
and the inferred (D/H)ices are given in Table 3 (note that the xH2 values are slightly
different from those given in Feuchtgruber et al. (1999) because there was a minor mistake in that paper).
Inferred D/H in protoplanetary ices.
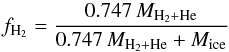
We also used the more recent Uranus and Neptune models of Helled et al. (2011). These models propose empirical pressure-density models tuned to match the planetary radii, masses, gravitational coefficients J2 and J4, and solid rotation periods determined by Voyager. The models are then interpreted in terms of bulk composition, i.e., the mass fractions of hydrogen (X), helium (Y), and heavy elements (Z). Two limiting cases are considered for heavy elements, which are either pure rock (represented for definiteness by SiO2) or pure ice (represented by H2O). Furthermore, two variants (I and II) are considered for the radial distribution of the heavy elements within the planetary interior. Obviously, the pure SiO2 cases are excluded from the point of view of the D/H ratio, since they would lead to a protosolar D/H ratio. We thus considered here the H2O cases. By definition, these models have F = 1. In this case, fH2 is simply given as fH2 = X / (X + Z).
Even more recently, interior models of Uranus and Neptune were updated by Nettelmann et al. (2013). These authors provide results based on full sets of three-layer interior models combined with different solid-body rotation periods, gravitational data, and physical equations of state (two models for Uranus and three models for Neptune). Values for xH2, fH2, and resulting (D/H)ices from all their models are given in Table 3.
For all the interior models considered, Table 3 indicates that the D/H ratio values for the protoplanetary ices of Uranus and Neptune are consistently 4–6 times lower than those found in the water-ice reservoirs of Oort-cloud comets (~(2–3) × 10-4, see Bockelée-Morvan et al. 2012), and still a factor of 2–3 lower compared to the D/H in Earth’s oceanic water (1.5 × 10⁻⁴), carbonaceous chondrites (1.4 × 10⁻⁴), and the Jupiter-family comet 103P/Hartley 2 (1.6 × 10⁻⁴, Hartogh et al. 2011).
It is somewhat unexpected to find that proto-uranian and proto-neptunian ices are much less D-rich than cometary ices, which warrants a brief discussion of the above hypothesis and derivation. A first problem is that (D/H)envelope may not be equal to (D/H)H2. This situation occurs if the planet envelope is heavily enriched in D/H-rich volatiles. However, even for an extreme water enrichment within the atmosphere (e.g., O/H = 440 times solar, as advocated for Neptune by Lodders & Fegley 1994), the (D/H)envelope is increased only by a factor 1.24 (Lécluse et al. 1996), leading to only a ~30% increase of (D/H)ices, insufficient by far for a reconciliation with cometary values. The second possibility is that the assumption of complete mixing is not valid. In a state of incomplete mixing, the derived values of (D/H)ices as per Table 3 would represent lower limits of the D/H ratio in the icy cores. Note, however, that the indistinguishable values of (D/H) in H2 (within error bars) in Uranus and Neptune (which still differ radically in terms of their internal energy sources and therefore presumably of their convective state) suggest that the current incomplete convection in Uranus’ interior may not be important in this respect. Therefore, this scenario is also obviously not promising.
The (D/H)ices values we infer for the protoplanetary ices correspond to a modest enrichment factor f ~ 2–3 over the protosolar value. Compared to the most pristine (i.e., D-rich) solar system material (i.e., the D/H-rich component of the LL3 meteorites, with f = 35) or even to typical cometary material (f ~ 7–20), this implies that the protoplanetary ices have been considerably reprocessed in the solar nebula. Yet evolutionary models (Kavelaars et al. 2011) accounting for radial turbulent mixing within the nebula predict much stronger enrichments (f = 14–20) at the estimated 12–15 AU formation distance of Uranus and Neptune. Along with the recently revealed diversity of the D/H ratio in comets (Hartogh et al. 2011; Bockelée-Morvan et al. 2012) and the apparent absence of a correlation of the values with the estimated formation distance of these comets (i.e., the Kuiper-Belt vs. Oort-cloud families) our result of a low D/H ratio in the Uranus and Neptune original ices would illustrate the limitation of these evolutionary models. Note also that given the error bars, we are unable to find any significant difference between the D/H ratio in the proto-uranian and proto-neptunian ices (see Table 3), which precludes a search for a correlation between the D/H ratio and the formation distance (as predicted by the evolutionary models).
The idea that the protoplanetary ices should necessarily have a deuterium content equal to that measured in cometary water may be challenged by the work of Alexander et al. (2012), however. These authors found a linear correlation between the D/H and C/H ratio measured in a set of carbonaceous chondrites (CC) from the CM and CR groups that experienced different degrees of aqueous alteration. This suggests that the hydrogen isotopic composition in these bodies results from the mixing between hydrated silicates and organic matter, and extrapolating the relationship to C/H = 0 should therefore give the isotopic composition of water. This approach provides (D/H)H2O ~9 × 10⁻⁵ for CMs (but ~17 × 10-5 for CRs). In a second approach, the authors corrected the D/H ratio measured in other types of chondrites from the contribution of organic material and inferred that in addition to CMs, the water compositions of the CIs, CO, CV, and Taglish Lake meteorites are less deuterium-rich than comets, with a D/H ratio generally below ~10 × 10-5. As chondrites are fragments of main-belt asteroids (and in particular, CCs are generally associated with C-type asteroids, which may have formed in the same region as comets, Walsh et al. 2011), this is consequently an indication that there may have existed material with a “low” D/H ratio in water ice originating from the formation region of comets. It might therefore not be irrelevant to relate the low values we infer for the proto-uranian/proto-neptunian ices ((4–9) × 10-5, see Table 3) to this material. However, a complication in this scenario is to understand why so far no comets have been observed to exhibit such a low D/H ratio, and what the origin of the cometary D/H enhancement is compared to this value.
Returning to the scenario where cometary ices are representative of protoplanetary ices, all the above calculations rely on interior models of Uranus and Neptune, that are not clearly constrained (see, e.g., a discussion on the effect of the uncertainty of the rotation period by Podolak & Helled 2012). It is therefore worthwhile to “invert” the problem, i.e., assume some value of (D/H)ices and constrain the interior structures. Because the pure SiO2 models of Helled et al. (2011) cannot explain a (D/H)H2 higher than the protosolar value, while the pure H2O models lead to too low values for (D/H)ices, it is clear that intermediate models (i.e., a mix of ice and silicates) are needed. We therefore searched for the ice mass ratio in the heavy element component (F = Mice / (Mice + Mrock), targeting (D/H)ices = 1.5 × 10⁻⁴ or 3 × 10⁻⁴. For a given input value of F, the X, Y, and Z values were interpolated from Table 3 of Helled et al. (2011), considering the average of cases I and II. Zice and Zrock are then given by F × Z and (1 − F) × Z, respectively, and (D/H)ices was obtained as before, using now fH2 = X / (X + Zice). Finally, the knowledge of X, Zice and Zrock permits us to derive the mass of H, the total mass of O, and the mass of O contained in the ice, which can be translated into O/H ratios. Results are given in Table 4, where the O/H ratios are expressed in mass, volume, and in the enhanced factor over the solar value (assuming a solar volume ratio of O/H = 4.9 × 10⁻⁴; Asplund et al. 2009). Of course the precise values given in Table 4 are somewhat dependent on the simplified description, attached to the Helled et al. (2011) models, that all ice is in the form of H2O and all rock in the form of SiO2. And again, results are subject to the validity of the complete mixing hypothesis: for incomplete mixing, the F values reported in Table 4 would represent lower limits to the actual ice mass fraction.
“Inferred” interior models.
The models in Table 4 have
F = 0.14–0.32. In other words, we infer that 68–86% of the heavy component
consists of rock and 14–32% is made of ice. Therefore, unlike in the Podolak et al. (1995) models and in the ice (H2O) version of
the Helled et al. (2011) models, we find that Uranus
and Neptune interiors might be more rocky than icy. This behavior is similar to the case of
Pluto, which based on the body density (~2 g cm-2), has an estimated rock mass
fraction of about 0.7 (Simonelli & Reynolds 1989). All the above models have Z = 78–81% per mass. With Uranus
and Neptune masses equal to 14.5 and 17.1 Earth masses, this gives ~11.6
M⊕ of heavy elements for Uranus and ~13.5
M⊕ for Neptune. This is to be compared with the findings by
Owen & Encrenaz (2003, 2006), who similarly used the enrichment in heavy elements in the giant
planets (mostly measured in carbon) to estimate the mass of the solar-composition icy
planetesimals (SCIP) within each planet. For Neptune, Owen & Encrenaz (2006) found a SCIP mass of (13 ± 3)
M⊕, fully consistent with our value. The agreement is worse
for Uranus, where Owen & Encrenaz (2006)
found (8.5 )
M⊕.
)
M⊕.
The total O/H ratio is 329–393 times solar, but when only O from H2O is
considered, the O/H ratio is 68–172 times solar. Independent constraints on the atmospheric
O/H ratio were inferred from the measured CO mixing ratio, a disequilibrium species whose
tropospheric abundance is sensitive both to the vigor of vertical mixing from the deep
atmosphere and to the O/H ratio (CO is produced from H2O from the net reaction
CH4 + H2O  CO + 3H2.) To explain the ~1 ppm CO abundance initially measured in Neptune’s
troposphere (Marten et al. 1993, Guilloteau et al.
1993) Lodders & Fegley (1994) invoked a 440 times solar O/H ratio in Neptune’s
deep atmosphere, using a solar O/H = 7.4 × 10⁻⁴. Rescaling this to O/H =
4.9 × 10⁻⁴ gives O/H = 660 times solar, which is 4.5–9 times higher than we
infer. We conclude that the Lodders & Fegley (1994) models are inconsistent with our D/H measurement, although reconciliation
may be possible if the CO abundance is indeed overestimated by a considerable factor.
Moreover, subsequent observations (Lellouch et al. 2005; Hesman et al. 2007; Luszcz-Cook
& de Pater 2013) all indicated that the
Neptune CO has two distinct components and that its tropospheric abundance is lower than
previously thought. Luszcz-Cook & de Pater (2013), in particular, determined a much lower (~0.1 ppm) CO tropospheric
abundance. However, by reassessing the Lodders & Fegley (1994) model, especially in terms of (i) the limiting reaction steps and
(ii) the characteristic mixing time, they still found that a global O/H enrichment of at
least 400, and likely more than 650, times the protosolar value is required to explain their
measured CO abundance. Therefore, the discrepancy with our estimate of the atmospheric O/H
remains.
CO + 3H2.) To explain the ~1 ppm CO abundance initially measured in Neptune’s
troposphere (Marten et al. 1993, Guilloteau et al.
1993) Lodders & Fegley (1994) invoked a 440 times solar O/H ratio in Neptune’s
deep atmosphere, using a solar O/H = 7.4 × 10⁻⁴. Rescaling this to O/H =
4.9 × 10⁻⁴ gives O/H = 660 times solar, which is 4.5–9 times higher than we
infer. We conclude that the Lodders & Fegley (1994) models are inconsistent with our D/H measurement, although reconciliation
may be possible if the CO abundance is indeed overestimated by a considerable factor.
Moreover, subsequent observations (Lellouch et al. 2005; Hesman et al. 2007; Luszcz-Cook
& de Pater 2013) all indicated that the
Neptune CO has two distinct components and that its tropospheric abundance is lower than
previously thought. Luszcz-Cook & de Pater (2013), in particular, determined a much lower (~0.1 ppm) CO tropospheric
abundance. However, by reassessing the Lodders & Fegley (1994) model, especially in terms of (i) the limiting reaction steps and
(ii) the characteristic mixing time, they still found that a global O/H enrichment of at
least 400, and likely more than 650, times the protosolar value is required to explain their
measured CO abundance. Therefore, the discrepancy with our estimate of the atmospheric O/H
remains.
Finally, we note that the O/H volume ratios for the H2O component are in the range 0.033–0.084, i.e., H2O / H2 = 0.07–0.17 in the atmosphere. This induces only a minor correction to (D/H)H2 (Lécluse et al. 1996), i.e. (D/H)envelope = (1.04–1.09) × (D/H)H2 and does not impact any of the above conclusions.
6. Conclusions
Herschel-PACS spectrometer observations combined with previous ISO-SWS observations of the three lowest energy rotational lines of HD on Uranus and Neptune have been analyzed. Applying latest spectroscopic line parameters for the HD R(0), R(1) and R(2) lines in multilayer atmospheric radiative transfer calculations, a least-squares fit of synthetic spectra to the continuum-divided measurements results in D/H values of (4.4 ± 0.4) × 10-5 for Uranus and (4.1 ± 0.4) × 10-5 (1σ) for Neptune. The simultaneous modeling of the three measured HD lines requires only small modifications to the thermal profiles (p,T) known from earlier work on the two planets. The new D/H ratio values, although somewhat lower than in previous analyses, confirm the enrichment of deuterium in the atmospheres of Uranus and Neptune compared to the protosolar nebula. Based on published interior models in which the largest fraction of the heavy elements is in the form of ice (70–100%), and assuming that complete mixing of the atmosphere and interior occured during the planets’ history, the required D/H ratio in the protoplanetary ices responsible for this enrichment is significantly lower than known from any water/ice source in the solar system. A possible solution to this unexpected result is that the interiors of Uranus and Neptune are dominated by rock. For icy material in the form of H2O and rocky material in the form of SiO2, an ice mass fraction of only 14–32% is found. Still, a complete interpretation of the now accurate values of Uranus and Neptune D/H ratio would be greatly aided by a more definite picture of their internal structures. The latter would benefit from improved gravity, shape, and rotation data, which could be obtained from planetary orbiters.
Acknowledgments
We thank Bruno Bézard for important advice on the HD line parameters, and Dominique Bockelée-Morvan for discussions on the D/H ratio in meteorites and comets. G. Orton carried out a part of this research at the Jet Propulsion Laboratory, California Institute of Technology, under a constract with NASA. T. Cavalié wishes to thank the Centre National d’Études Spatiales (CNES) for funding. F. Billebaud acknowledges multi-annual funding from the Programme National de Planétologie (PNP) of CNRS/INSU. PACS has been developed by a consortium of institutes led by MPE (Germany) and including UVIE (Austria); KUL, CSL, IMEC (Belgium); CEA, OAMP (France); MPIA (Germany); IFSI, OAP/AOT, OAA/CAISMI, LENS, SISSA (Italy); IAC (Spain). This development has been supported by the funding agencies BMVIT (Austria), ESA-PRODEX (Belgium), CEA/CNES (France), DLR (Germany), ASI (Italy), and CICYT/MCYT (Spain).
References
- Asplund, M., Grevesse, N., Sauval, A. J., & Scott, P. 2009, ARA&A, 47, 481 [NASA ADS] [CrossRef] [Google Scholar]
- Alexander, C. M. O’D, Bowden, R., Fogel, M. L., et al. 2012, Science, 337, 721 [NASA ADS] [CrossRef] [PubMed] [Google Scholar]
- de Bergh, C., Lutz, B. L., Owen, T., Brault, J., & Chauville, J. 1986, ApJ, 311, 501 [NASA ADS] [CrossRef] [Google Scholar]
- de Bergh, C., Lutz, B. L., Owen, T., & Maillard, J. P. 1990, ApJ, 355, 661 [NASA ADS] [CrossRef] [Google Scholar]
- Bézard, B., Romani, P. N., Conrath, B. J., & Maguire, W. C. 1991, J. Geophys. Res., 96, 18961 [NASA ADS] [CrossRef] [Google Scholar]
- Bockelée-Morvan, D., Biver, N., Swinyard, B., et al. 2012, A&A, 544, L15 [NASA ADS] [CrossRef] [EDP Sciences] [Google Scholar]
- Borysow, A., & Frommhold, L. 1986, ApJ, 304, 849 [NASA ADS] [CrossRef] [Google Scholar]
- Borysow, A., & Frommhold, L. 1987, ApJ, 318, 940 [NASA ADS] [CrossRef] [Google Scholar]
- Borysow, J., Trafton, L., Frommhold, L., & Birnbaum, G. 1985, ApJ, 296, 644 [NASA ADS] [CrossRef] [Google Scholar]
- Borysow, J., Frommhold, L., & Birnbaum, G. 1988, ApJ, 326, 509 [NASA ADS] [CrossRef] [Google Scholar]
- Brown, P. D., & Millar, T. J. 1989, MNRAS, 237, 661 [NASA ADS] [Google Scholar]
- Clegg, P. E., Ade P. A. R., Armand, C., et al. 1996, A&A, 315, L38 [NASA ADS] [Google Scholar]
- Davies, G. R., Fulton, T. R., Sidher, S. D., et al. 2000, ESA SP-456, 29 [Google Scholar]
- Drakopoulos, P. G., & Tabisz, G. C. 1987a, Phys. Rev. A, 36, 5556 [NASA ADS] [CrossRef] [Google Scholar]
- Drakopoulos, P. G., & Tabisz, G. C. 1987b, Phys. Rev. A, 36, 5566 [NASA ADS] [CrossRef] [Google Scholar]
- Encrenaz, T., de Graauw, T., Schaeidt, S., et al. 1996, A&A, 315, L397 [NASA ADS] [Google Scholar]
- Evenson, K. M., Jennings, D. A., Brown, J. M., et al. 1988, ApJ, L330 [Google Scholar]
- Feuchtgruber, H., Lellouch, E., Bézard, B., et al. 1999, A&A, 341, L17 [NASA ADS] [Google Scholar]
- Fletcher, L., Drossart, P., Burgdorf, M., et al. 2010, A&A, 514, A17 [NASA ADS] [CrossRef] [EDP Sciences] [Google Scholar]
- Gautier, D., & Hersant, F. 2005, Space Sci. Rev., 116, 25 [NASA ADS] [CrossRef] [Google Scholar]
- de Graauw Th., Haser L. N., Beintema D. A., et al. 1996, A&A, 315, L49 [NASA ADS] [Google Scholar]
- Griffin, M. J., Naylor, D. A., Davis, G. R., et al. 1996, A&A, 315, L389 [NASA ADS] [Google Scholar]
- Guillot, T. 1999, Science, 286, 72 [NASA ADS] [CrossRef] [PubMed] [Google Scholar]
- Guillot, T. 2005, Ann. Rev. Earth Plan. Sci., 33, 493 [Google Scholar]
- Guilloteau, S., Dutrey, A., Marten, A., & Gautier, D. 1993, A&A, 279, 661 [NASA ADS] [Google Scholar]
- Hartogh, P., Lellouch, E., Crovisier, J., et al. 2009, Planet. Space Sci., 57, 1596 [NASA ADS] [CrossRef] [Google Scholar]
- Hartogh, P., Lis, D. C., Bockelée-Morvan, D., et al. 2011, Nature, 468, 218 [NASA ADS] [CrossRef] [Google Scholar]
- Helled, R., Anderson, J. D., Podolak, M., & Schubert, G. 2011, ApJ, 726, 15 [NASA ADS] [CrossRef] [Google Scholar]
- Hersant, F., Gautier, D., & Huré, J.-M. 2001, ApJ, 554, 391 [NASA ADS] [CrossRef] [Google Scholar]
- Hesman, B. E., Davis, G. R., Matthews, H. E., & Orton, G. S. 2007, Icarus, 186, 342 [NASA ADS] [CrossRef] [Google Scholar]
- Hofstadter M. D., & Butler, B. J. 2003, Icarus, 165, 168 [NASA ADS] [CrossRef] [Google Scholar]
- Hofstadter, M. D., Butler, B., Gurwell, M., et al. 2011, EPSC-DPS Joint Meeting, 6, 691 [NASA ADS] [Google Scholar]
- Hubbard, W. B., & McFarlane, J. J. 1980, Icarus, 44, 676 [NASA ADS] [CrossRef] [Google Scholar]
- Irwin, P. G. J., de Bergh, C., Courtin, R., et al. 2012, Icarus, 220, 369 [NASA ADS] [CrossRef] [Google Scholar]
- Kavelaars, J. J., Mousis, O., Petit, J.-M., & Weaver, H. A. 2011, ApJ, 734, L30 [NASA ADS] [CrossRef] [Google Scholar]
- Kessler, M. F., Steinz, J. A., Anderegg, M. E., et al. 1996, A&A, 315, L27 [NASA ADS] [Google Scholar]
- Lécluse, C., Robert, F., Gautier, D., & Guiraud, M. 1996, Planet. Space Sci., 44, 12, 1579 [Google Scholar]
- Lellouch, E., Bézard, B., Fouchet, T., et al. 2001, A&A, 670, 610 [CrossRef] [EDP Sciences] [Google Scholar]
- Lellouch, E., Moreno, R., & Paubert, G. 2005, A&A, 430, L37 [NASA ADS] [CrossRef] [EDP Sciences] [Google Scholar]
- Lellouch, E., Hartogh, P., Feuchtgruber, H., et al. 2010, A&A, 518, L152 [NASA ADS] [CrossRef] [EDP Sciences] [Google Scholar]
- Lindal, G. F., Lyons, J. R., Sweetnam, D. N., Eshleman, V. R., & Hinson, D. P. 1990, Geophys. Res. Lett., 17, 1733 [NASA ADS] [CrossRef] [Google Scholar]
- Lodders, K., & Fegley, B. 1994, Icarus, 112, 368 [NASA ADS] [CrossRef] [Google Scholar]
- Lu, Z., Tabisz, G. C., & Ulivi, L. 1993, Phys. Rev. A, 47, 2, 1159 [Google Scholar]
- Luszcz-Cook, S. H., & de Pater, I. 2013, Icarus, 222, 379 [NASA ADS] [CrossRef] [Google Scholar]
- Marten, A., Gautier, D., Owen, T., et al. 1993, ApJ, 406, 285 [NASA ADS] [CrossRef] [Google Scholar]
- Nettelmann, N., Helled, R., Fortney, J. J., & Redmer, R. 2013, Planet. Space Sci., accepted [Google Scholar]
- Orton, G. S., Lacy, J. H., Achtermann, J. M., Parmar, P., & Blass, W. E. 1992, Icarus, 100, 541 [NASA ADS] [CrossRef] [Google Scholar]
- Orton, G. L., Gutsafsson, M., Burgdorf, M., & Measdows, V. 2007, Icarus, 189, 544 [NASA ADS] [CrossRef] [Google Scholar]
- Orton, G. S., Moses, J. I., Fletcher, L. N., et al. 2013, Icarus, submitted [Google Scholar]
- Owen, T., & Encrenaz, T. 2003, Space Sci. Rev., 106, 121 [NASA ADS] [CrossRef] [Google Scholar]
- Owen, T., & Encrenaz, T. 2006, Plan. Space Sci., 54, 1188 [Google Scholar]
- Owen, T., Mahaffy, P., Niemann, H., B., et al. 1999, Nature, 402, 269 [NASA ADS] [CrossRef] [Google Scholar]
- Pilbratt, G., Riedinger, J. R., Passvogel, T., et al., 2010, A&A, 518, L1 [CrossRef] [EDP Sciences] [Google Scholar]
- Podolak, M., & Helled, R. 2012, ApJ, 759, L32 [NASA ADS] [CrossRef] [Google Scholar]
- Podolak, M., Weizman, A., & Marley, M. 1995, Planet. Space Sci., 43, 1517 [NASA ADS] [CrossRef] [Google Scholar]
- Pollack, J. B., & Bodenheimer, F. 1989, in Theories of the Origin and Evolution of Planetary and Satellite Atmospheres, eds. S. K. Atreya, J. B. Pollack, & M. S. Matthews (Tucson: Univ. of Arizona Press), 564 [Google Scholar]
- Poglitsch, A., Waelkens, C., Geis, N., et al. 2010, A&A, 518, L2 [NASA ADS] [CrossRef] [EDP Sciences] [Google Scholar]
- Ramanlal, J., & Tennyson, J. 2004, MNRAS, 354, 161 [NASA ADS] [CrossRef] [Google Scholar]
- Simonelli, D. P., & Reynolds, R. T. 1989, Geo. Res. Lett., 16, 1209 [NASA ADS] [CrossRef] [Google Scholar]
- Smith, W. H., Schempp, W. V., & Baines, K. H. 1989a, ApJ, 336, 967 [NASA ADS] [CrossRef] [Google Scholar]
- Smith, W. H., Schempp, W. V., & Simon, J., Baines 1989b, ApJ, 336, 962 [NASA ADS] [CrossRef] [Google Scholar]
- Trafton, L., & Ramsay, D. A. 1980, Icarus, 41, 423 [NASA ADS] [CrossRef] [Google Scholar]
- Trauger, J. T., Roesler, F. L., Carleton, N. P., & Traub, W. A. 1973, ApJ, 184, L137 [NASA ADS] [CrossRef] [Google Scholar]
- Ulivi, L., de Natale, P., & Inguscio, M. 1991, ApJ, 378, L29 [NASA ADS] [CrossRef] [Google Scholar]
- Walsh, K. J., Morbidelli, A., Raymond, S. N., et al. 2011, Nature, 475, 206 [NASA ADS] [CrossRef] [PubMed] [Google Scholar]
- Watson, W. D. 1974, ApJ, 188, 35 [NASA ADS] [CrossRef] [Google Scholar]
All Tables
All Figures
|
Fig. 1 Monochromatic contribution function for the three HD lines (red: R(0); green: R(1); blue: R(2)). Solid: line core; dashed: continuum. |
| In the text | |
|
Fig. 2 Thermal (p,T) profiles for the two planets. Neptune: dark blue = baseline profile (Bézard et al. 1991); green = Feuchtgruber et al. (1999); light blue = Lellouch et al. (2010); red = best-fit profile to the three HD lines; Uranus: blue = baseline profile (Orton et al. 2013); green = Feuchtgruber et al. (1999); red = best-fit profile to the three HD lines; light blue = best fit to R(0) and R(1) lines only. |
| In the text | |
|
Fig. 3 Observed and synthetic Uranus spectra. Black: continuum-divided spectra (solid: range scan; dashed: HssO line scan; dotted: OT line scans) and best-fit model (red) with D/H = 4.41 × 10⁻⁵. Synthetic spectra for different D/H ratios but for the same thermal profile to illustrate the sensitivity to this model parameter are shown as green solid lines for D/H = 3.4 × 10⁻⁵ and D/H = 5.4 × 10⁻⁵ (3σ) and blue solid lines for D/H = 4.07 × 10⁻⁵ and D/H = 4.75 × 10⁻⁵ (1σ). The spectral line around 56.33 μm is caused by stratospheric H2O emission and is not included in the model. The R(2) line has been measured by ISO-SWS. |
| In the text | |
|
Fig. 4 Observed and synthetic Neptune spectra. Black: continuum-divided spectra (solid: range scan; dashed: GT line scan; dotted: OT line scans) and best-fit model (red) with D/H = 4.08 × 10⁻⁵. Synthetic spectra for different D/H ratios but for the same thermal profile to illustrate the sensitivity to this model parameter are shown as green solid lines for D/H = 3.09 × 10⁻⁵ and D/H = 5.07 × 10⁻⁵ (3σ) and blue solid lines for D/H = 3.75 × 10⁻⁵ and D/ H = 4.41 × 10⁻⁵ (1σ). The R(1) line has been observed in two different grating orders (n) and accordingly at different instrumental resolution. The strong spectral line around 56.33 μm is caused by stratospheric H2O emission and is not included in the model. The R(2) line has been measured by ISO-SWS. |
| In the text | |
Current usage metrics show cumulative count of Article Views (full-text article views including HTML views, PDF and ePub downloads, according to the available data) and Abstracts Views on Vision4Press platform.
Data correspond to usage on the plateform after 2015. The current usage metrics is available 48-96 hours after online publication and is updated daily on week days.
Initial download of the metrics may take a while.