Fig. 3
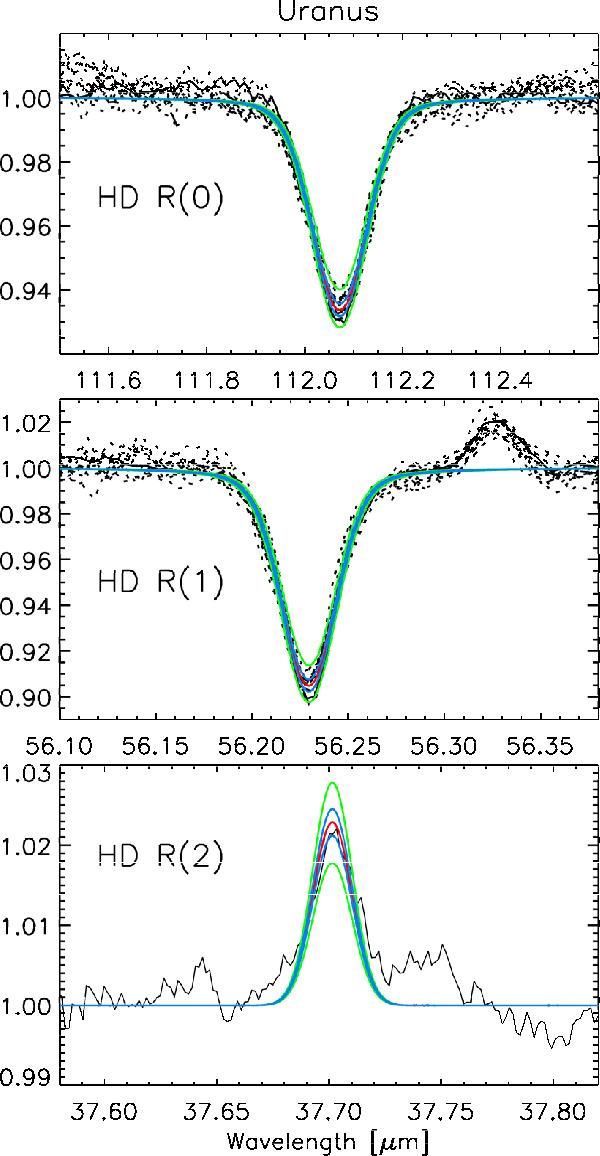
Observed and synthetic Uranus spectra. Black: continuum-divided spectra (solid: range scan; dashed: HssO line scan; dotted: OT line scans) and best-fit model (red) with D/H = 4.41 × 10⁻⁵. Synthetic spectra for different D/H ratios but for the same thermal profile to illustrate the sensitivity to this model parameter are shown as green solid lines for D/H = 3.4 × 10⁻⁵ and D/H = 5.4 × 10⁻⁵ (3σ) and blue solid lines for D/H = 4.07 × 10⁻⁵ and D/H = 4.75 × 10⁻⁵ (1σ). The spectral line around 56.33 μm is caused by stratospheric H2O emission and is not included in the model. The R(2) line has been measured by ISO-SWS.
Current usage metrics show cumulative count of Article Views (full-text article views including HTML views, PDF and ePub downloads, according to the available data) and Abstracts Views on Vision4Press platform.
Data correspond to usage on the plateform after 2015. The current usage metrics is available 48-96 hours after online publication and is updated daily on week days.
Initial download of the metrics may take a while.