Fig. 4
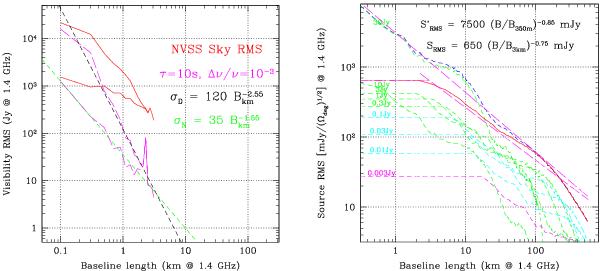
Measured visibility “noise” due to the NVSS > 10 Jy sky as seen by the VLA C configuration without primary beam attenuation (left). The two solid curves show the fluctuation level with and without the inclusion of the Sun. The two dashed curves include the effects of time and frequency smearing and are overlaid with representative power-law approximations. Visibility “noise” per solid angle due to the NVSS sky (right). The rms contribution of NVSS sources, normalised to a one square degree field of view, is plotted as function of baseline length. Flux bins from Table 1 are shown individually with the labelled curves. The root squared sum of contributions of the bins <10 Jy is shown as the solid line, together with an overlaid powerlaw fit.
Current usage metrics show cumulative count of Article Views (full-text article views including HTML views, PDF and ePub downloads, according to the available data) and Abstracts Views on Vision4Press platform.
Data correspond to usage on the plateform after 2015. The current usage metrics is available 48-96 hours after online publication and is updated daily on week days.
Initial download of the metrics may take a while.