Fig. 10
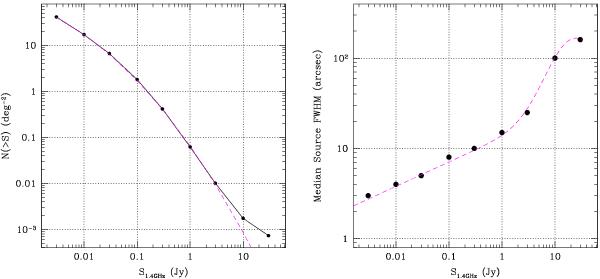
NVSS 1.4 GHz source counts (left) per 0.5 dex bin are shown as the filled points connected by a solid line. The analytic approximation over the range 0.003 < S1.4 < 3. Jy that is given by Eq. (47) is overlaid as the dashed curve. The median source size from Table 1 overlaid with an analytic approximation is shown in the right hand panel.
Current usage metrics show cumulative count of Article Views (full-text article views including HTML views, PDF and ePub downloads, according to the available data) and Abstracts Views on Vision4Press platform.
Data correspond to usage on the plateform after 2015. The current usage metrics is available 48-96 hours after online publication and is updated daily on week days.
Initial download of the metrics may take a while.