| Issue |
A&A
Volume 551, March 2013
|
|
|---|---|---|
| Article Number | A71 | |
| Number of page(s) | 9 | |
| Section | Interstellar and circumstellar matter | |
| DOI | https://doi.org/10.1051/0004-6361/201219816 | |
| Published online | 25 February 2013 | |
Carbon monoxide in the environs of the star WR 16
1
Instituto Argentino de Radioastronomía,
CONICET, CCT-La Plata, C.C.5.,
1894
Villa Elisa,
Argentina
e-mail:
This email address is being protected from spambots. You need JavaScript enabled to view it.
2
Facultad de Ciencias Astronómicas y Geofísicas, Universidad
Nacional de La Plata, Paseo del
Bosque s/n, 1900
La Plata,
Argentina
3
Departamento de Astronomía, Universidad de Chile,
Casilla 36-D, Santiago, Chile
Received:
14
June
2012
Accepted:
6
December
2012
Abstract
Aims. We analyze the carbon monoxide emission around the star WR 16 aiming to study the physical characteristics of the molecular gas linked to the star and to achieve a better understanding of the interaction between massive stars with their surroundings.
Methods. We study the molecular gas in a region in size using CO J = 1 → 0 and 13CO J = 1 → 0 line data obtained with the 4-m NANTEN telescope. Radio continuum archival data at 4.85 GHz, obtained from the Parkes-MIT-NRAO Southern Radio Survey, are also analyzed to account for the ionized gas. Available IRAS (HIRES) 60 μm and 100 μm images are used to study the characteristics of the dust around the star.
Results. Our new CO and 13CO data allow the low/intermediate density molecular gas surrounding the WR nebula to be completely mapped. We report two molecular features at −5 km s-1 and −8.5 km s-1 (components 1 and 2, respectively) having a good morphological resemblance with the Hα emission of the ring nebula. Component 2 seems to be associated with the external ring, while component 1 is placed at the interface between component 2 and the Hα emission. We also report a third molecular feature ~10′ in size (component 3) at a velocity of −9.5 km s-1 having a good morphological correspondence with the inner optical and IR emission, although high resolution observations are recommended to confirm its existence. The stratified morphology and kinematics of the molecular gas could be associated to shock fronts and high mass-loss events related to different evolutive phases of the WR star, which have acted upon the surrounding circumstellar molecular gas. An analysis of the mass of component 1 suggests that this feature is composed of swept-up interstellar gas and is probably enriched by molecular ejecta. The direction of the proper motion of WR 16 suggests that the morphology observed at infrared, optical, radio continuum, and probably molecular emission of the inner ring nebula is induced by the stellar motion.
Key words: molecular data / stars: Wolf-Rayet / ISM: molecules
© ESO, 2013
1. Introduction
The interstellar medium (ISM) surrounding massive stars is expected to be strongly modified and disturbed by the stellar winds and ionizing radiation. There is now consensus that massive stars (≥30 M⊙) evolve through a sequence of three stages, each of them characterized by a different kind of wind (Garcia-Segura & Mac Low 1995a,b). During the long-lived O phase (t ~ (2−4) × 106 yr), the gas around the star is first ionized by the high Lyman continuum flux, producing an Hii region that is later evacuated by the powerful stellar winds creating an “interstellar bubble” (IB; Castor et al. 1975; Dyson 1977; Weaver et al. 1977). The latter have been successfully detected both as thermal radio continuum shells and in the 21 cm line of atomic hydrogen (Arnal 1992; Cappa et al. 1996; Arnal et al. 1999) in the form of shells having diameters of tens of parsecs and expansion velocities of 6−20 km s-1. In the short-lived red supergiant (RSG) (t ~ (2−3) × 105 yr) and luminous blue variable (LBV) (t ~ 1 × 10⁴ yr) stages, the stellar wind becomes denser and slower and ejections of up to tens of solar masses take place. The Wolf-Rayet (WR) stage (t ~ (2−6) × 105 yr) is the last evolutionary phase of the massive stars prior to its explosion as a supernova, and is characterized by a fast and chemically enriched stellar wind that rapidly reaches and interacts with the previous RSG/LBV wind creating a ring nebula (Chu 1981; Chu & Treffers 1981a,b; Chu et al. 1982). As a result, the mutual interactions between stellar winds and ejecta of different stages may form multiple shells in the ISM on scales from tenths to tens of parsecs during the star evolution (Garcia-Segura et al. 1996a,b).
Since studies of the ISM around WR stars can provide important information about the interaction between massive stars and their environs, molecular line observations are crucial instruments for understanding that interaction. The molecular gas around WR stars has been analyzed in the past few years. One of the best studied cases is the ring nebula NGC 2359 around the star WR 7 (Rizzo et al. 2001a,b; Cappa et al. 2001), which shows clear signs of interaction between the star and its molecular and ionized environment. The stratification of the kinematics, morphology, and density of the molecular gas with respect to the central star can be associated to several energetic events related to different evolutionary stages previous to the actual WR phase like RSG or LVB phases (Rizzo et al. 2003).
The Hα ring nebula around the WN8h star WR 16 (≡HD 86161; van der Hucht 2001) was first noticed by Marston et al. (1994). The nebula consists of a double ring system with a very intense inner ring ~5′ north from the star, while the outer ring is northwest of it at ~8′. The emission of the outer ring appears to extend to the southeast of the star. For the sake of clarity, in Fig. 1 the Hα emission distribution around WR 16 obtained from the Super Cosmos Hα Survey (SHS)1 is shown. The stratified distribution of the Hα emission around WR 16 may be indicative of an evolution of the ISM associated with different stages prior to the WR phase, which makes this nebula an excellent laboratory to study the interaction between WR stars with their environs. Marston et al. (1999) surveyed the CO J = 1 → 0 line in a grid of ~20′ × 14′ centered at WR16 using SEST (HPBW = 45′′). They found a molecular “cocoon” at a radial velocity2 of ~−5 km s-1 around WR 16. They estimated a total molecular mass in the range 5−78 M⊙. This fact, together with a chemical enrichment observed towards the inner part of the nebula, led the authors to suggest an stellar origin for both the inner nebula and the molecular gas.
Spectrophotometric distances of WR 16 have been estimated by several authors: 2.6 kpc (Conti & Vacca 1990), 2 kpc (Marston et al. 1999), 2.37 kpc (van der Hucht 2001). In this paper we adopt an averaged value of 2.3 ± 0.3 kpc.
Although providing important information about the molecular gas associated with the close surroundings around WR 16, the observations of Marston et al. (1999) do not provide an entire picture of the molecular environment of the nebula because they observed the distribution of the molecular gas in a limited region around the WR star. Clearly, the CO emission distribution extends well beyond the area surveyed by these authors. In order to complete the analysis of Marston et al. (1999), we study the molecular gas over a region ~86′ × 86′ around the star using observations of the J = 1 → 0 transition of the CO and 13CO molecules. Our aim is to investigate the morphology, kinematics, and physical properties of the molecular environment of WR 16 in more detail. To account for the properties of the ionized gas and dust we analyze available archival radio continuum and infrared (IR) data. The observations and databases used in this work are outlined in Sect. 2, the results are described in Sect. 3, and the discussion in Sect. 4. Concluding remarks are presented in Sect. 5.
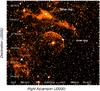 |
Fig. 1 Super Cosmos Hα image of the ring nebula around WR 16. |
2. Observations and data bases
2.1. CO data
The CO J = 1 → 0 data were obtained using the 4-m NANTEN millimeter-wave
telescope of Nagoya University. At the time we carried out the observations (April 2001),
this telescope was installed at Las Campanas Observatory, Chile. The half-power beamwidth
and the system temperature, including the atmospheric contribution towards the zenith,
were 26 (~1.7 pc at 2.3 kpc) and ~220 K (SSB) at 115 GHz, respectively. The data were
gathered using the position-switching mode with absolute reference positions; the points
devoid of CO emission, used as reference, were available at the observatory and observed
interspersed among the program positions. The spectrometer used was acousto-optical with
2048 channels with a frequency resolution of 20 kHz (equivalent to 0.055 km s-1
at 115 GHz), which provides a total coverage of ~113 km s-1. For intensity
calibrations, a room-temperature chopper wheel was employed (Penzias & Burrus 1973). An absolute intensity calibration
(Ulich & Haas 1976; Kutner & Ulich 1981) was achieved by observing Orion KL and
ρ Oph East. The absolute radiation temperatures,
 , of Orion KL
and ρ Oph East, which were both observed by the NANTEN radio telescope,
were assumed to be 65 K and 15 K, respectively (Moriguchi
et al. 2001). A second-order degree polynomial was subtracted from the
observations to account for instrumental baseline effects. The spectra were reduced using
CLASS software3. The CO observations were centered at
(l,b) = (281°04′47′′
−02°33′03′′) ((RA, Dec)J2000 =
09h54m53s
−57°43′38′′) with two areas covered by different
samplings. An inner area of was sampled one beam apart, while a larger area of was sampled
every 54 (two beamwidth). This technique allowed us to obtain two datacubes covering
different areas around WR 16. The integration time per point was 16 s resulting in a
typical rms noise of ~0.3 K.
, of Orion KL
and ρ Oph East, which were both observed by the NANTEN radio telescope,
were assumed to be 65 K and 15 K, respectively (Moriguchi
et al. 2001). A second-order degree polynomial was subtracted from the
observations to account for instrumental baseline effects. The spectra were reduced using
CLASS software3. The CO observations were centered at
(l,b) = (281°04′47′′
−02°33′03′′) ((RA, Dec)J2000 =
09h54m53s
−57°43′38′′) with two areas covered by different
samplings. An inner area of was sampled one beam apart, while a larger area of was sampled
every 54 (two beamwidth). This technique allowed us to obtain two datacubes covering
different areas around WR 16. The integration time per point was 16 s resulting in a
typical rms noise of ~0.3 K.
2.2. 13CO data
The radio astronomical group at Nagoya University has carried out a 13CO J = 1 → 0 survey of the Galactic plane using the NANTEN telescope. In this work we use part of this unpublished survey that was kindly provided to us by the group. The beam size of the telescope at 13CO frequency (110 GHz) is 27, and the typical rms noise is ~0.2 K. The frequency resolution is 40 kHz (equivalent to 0.1 km s-1 at 110 GHz). Observations were made in position-switching mode and at a grid spacing of 4′.
2.3. Complementary data
The CO and 13CO data are complemented with narrow-band Hα data retrieved from the SuperCOSMOS H-alpha Survey (SHS). The images have a sensitivity of 5 Rayleigh (1 Rayleigh = 2.41 × 10⁻⁷ erg cm-2 s-1 sr-1), and ~1′′ spatial resolution (Parker et al. 2005). We also include radio continuum 4.85 GHz data retrieved from the Parkes-MIT-NRAO (PMN) Southern Radio Survey. The images have ~5′ resolution and ~8 mJy beam-1 total rms noise (Condon et al. 1993). To study the characteristics of the dust in the nebula we use infrared images at 60 μm and 100 μm retrieved from the high resolution IRAS images (HIRES) database4 (Fowler & Aumann 1994).
3. Results and analysis of the observations
3.1. Distribution and physical properties of the CO and 13CO
We looked for molecular gas in the environs of WR 16 using several CO spectra obtained towards different positions around the star. After a careful inspection of the individual spectra, we noted that the bulk of the CO emission is concentrated in the velocity range from ~−10 km s-1 to ~−3 km s-1. We used a mean radial velocity of ~−6 km s-1 to make a rough estimate of the kinematical distance. Using the analytical fit to the circular galactic rotation model of Brand & Blitz (1993) along l ≈ 281°, we estimate near and far kinematical distances of about 0.6 kpc and 2.8 kpc, respectively. As a result, the far kinematical distance agrees (within errors) with the adopted distance for WR 16. This is indicative of a likely association between the molecular gas detected in the mentioned velocity range and the WR star. We have to keep in mind, however, that noncircular motions of up to 8 km s-1 are known to exist in the Galaxy (Burton & Gordon 1978; Brand & Blitz 1993) which are of the same order of the velocity of the molecular feature. Although this might introduce large uncertainties into the kinematical distance determination, it suffices for discerning between near and far kinematical distance.
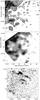 |
Fig. 2 Distribution of the mean CO emission integrated in the velocity range from −7.2 km s-1 to −3.2 km s-1. The beam size of the CO observations is shown by a white circle in the lower left corner of each image. The position of WR 16 is marked by a plus sign at the center of each image. a) Emission distribution of the 13CO J = 1 → 0. The lowest temperature contour is 0.16 K (~5 rms). The contour-spacing temperature is 0.08 K till 0.48 K, and here onwards the contour spacing is 0.35 K. b) Emission distribution of the CO J = 1 → 0. The lowest temperature contour is 0.8 K (~10 rms) and the contour-spacing temperature is 0.7 K. c) Overlay of the mean CO emission in the velocity range from −7.2 km s-1 to −3.2 km s-1 (contours) and the Hα emission (gray scale) in the central region. Contour levels are the same as in Fig. 2b. |
We have analyzed the CO and 13CO data cubes in velocity intervals of 0.2 km s-1 within the mentioned velocity range. This strategy allowed us to identify three molecular features that are morphologically correlated with different regions of the ring nebula. The central velocities of these features are approximately at −5, −8.5, and −9.5 km s-1. With the aim of facilitating further analysis we refer to these features as component 1, component 2, and component 3, respectively. In the following, we describe and analyze the three features in detail.
3.1.1. Component 1
In Figs. 2a and b we show the emission distribution of the 13CO and CO lines, respectively, in the velocity range from −7.2 km s-1 to −3.2 km s-1. Although the emission lines of CO and 13CO trace the molecular gas of different densities, a molecular feature close to WR 16 stands out in both figures. This feature engulfs a low molecular emission region centered on the position of WR 16, surrounding the star from east to south. Figure 2b also shows that the CO feature appears to be projected onto a more extended CO plateau having a relatively strong (~10 rms) emission that extends towards a large and bright molecular structure lying ~20′ to the north and east, which is likely part of the galactic disk.
In order to follow in more detail the morphology of component 1 and to compare with the Hα emission, we show in Fig. 2c an overlay of the CO emission in the velocity range from −7.2 km s-1 to −3.2 km s-1 obtained with the 324 × 324 datacube, with the SHS emission of the ring nebula. Differences in the contour lines between Figs. 2b and c are due to the different sampling of both datacubes. This molecular feature has already been reported by Marston et al. (1999), and is referred to in that work as a “molecular cocoon”.
We identify a number of clouds in the CO and 13CO emissions. They are
labeled as a1, a2, and a3 for the
13CO map, while for the CO image they are labeled as b1
and b2. This identification is arbitrary and was only made to
facilitate further analysis. Cloud a1 is very likely the
13CO counterpart of b1. On the other hand, a2
and a3 are possibly the counterparts of b2
which appear as a single structure due to the worse CO sampling. Assuming that
the 13CO J = 1 → 0 line is in local thermodynamic
equilibrium (LTE), we follow the method described by Dickman (1978) to calculate some physical parameters, such as the peak optical
depth, τ(13CO) and the molecular column density,
N(13CO). To use this method we assume that
τ(13CO) ≪ 1, τ(CO) ≫ 1, and
Texc(CO) =
Texc(13CO). Afterwards, we calculate the total
hydrogen mass, M(H2), via  (1)where
msun is the solar mass (~2 × 1033 g),
μ is the mean molecular weight, which is assumed to be equal to 2.8
after allowance of a relative helium abundance of 25% by mass (Yamaguchi et al. 1999), mH is the
hydrogen atom mass (~1.67 × 10⁻²⁴ g), Ω is the solid angle subtended by
the CO feature in ster, d is the assumed distance expressed in cm, and
N(H2) is the H2 column density, obtained using
a “canonical” abundance
N(H2)/N(13CO) = 5 × 10⁵
(Dickman 1978). We also estimate the optical
depth of the CO J = 1 → 0 line from the 13CO
J = 1 → 0 line with
τ(CO) ≈ (CO/13CO)τ(13CO),
where CO/13CO is the isotope ratio (assumed to be ~62; Langer & Penzias 1993). It is worth pointing out that we
adopted peak values of
(1)where
msun is the solar mass (~2 × 1033 g),
μ is the mean molecular weight, which is assumed to be equal to 2.8
after allowance of a relative helium abundance of 25% by mass (Yamaguchi et al. 1999), mH is the
hydrogen atom mass (~1.67 × 10⁻²⁴ g), Ω is the solid angle subtended by
the CO feature in ster, d is the assumed distance expressed in cm, and
N(H2) is the H2 column density, obtained using
a “canonical” abundance
N(H2)/N(13CO) = 5 × 10⁵
(Dickman 1978). We also estimate the optical
depth of the CO J = 1 → 0 line from the 13CO
J = 1 → 0 line with
τ(CO) ≈ (CO/13CO)τ(13CO),
where CO/13CO is the isotope ratio (assumed to be ~62; Langer & Penzias 1993). It is worth pointing out that we
adopted peak values of  , which yields upper limits
for the line opacities, column densities, and molecular masses.
, which yields upper limits
for the line opacities, column densities, and molecular masses.
The mass of the molecular gas can also be estimated using the CO
J = 1 → 0 line by two methods: (a) Using the relation
between integrated emission of the CO J = 1 → 0 line,
I(CO) =  , and molecular hydrogen
column density, N(H2), and (b) the virial
theorem. For the first method we use
, and molecular hydrogen
column density, N(H2), and (b) the virial
theorem. For the first method we use  (2)The
X-factor lies in the range (1–3) × 1020 cm-2
(K km s-1)-1, as estimated by the virial theorem and
γ-ray emission (Bloemen et al.
1986; Solomon et al. 1987; Bertsch et al. 1993; Digel et al. 1996; Strong & Mattox
1996). In this paper we adopt X = 1.6 × 10²⁰
cm-2 (K km s-1)-1 (Hunter et al. 1997). For the second method, considering only gravitational and
internal pressure and assuming a spherically symmetric cloud with a
r-1 density distribution, the molecular mass can be
determined from
(2)The
X-factor lies in the range (1–3) × 1020 cm-2
(K km s-1)-1, as estimated by the virial theorem and
γ-ray emission (Bloemen et al.
1986; Solomon et al. 1987; Bertsch et al. 1993; Digel et al. 1996; Strong & Mattox
1996). In this paper we adopt X = 1.6 × 10²⁰
cm-2 (K km s-1)-1 (Hunter et al. 1997). For the second method, considering only gravitational and
internal pressure and assuming a spherically symmetric cloud with a
r-1 density distribution, the molecular mass can be
determined from  (3)(MacLaren et al. 1988), where
 is the effective radius in parsecs, and Δvcld is defined as
the FWHM line width of the composite profile derived by using a single Gaussian fitting.
The composite profile is obtained by averaging all the spectra within the area of the
cloud (Acloud). The uncertainties involved are about 40%,
mostly due to the estimates of R. In Table 1 we summarize some of the physical parameters detailed above,
obtained for the molecular clouds constituting component 1. The values of
N(H2)X and
M(H2)X are the hydrogen column
density and molecular mass, respectively, determined using Eq. (2), while
N(13CO)LTE and
M(H2)LTE are the 13CO column density
and molecular mass obtained by assuming LTE. The virialized mass is given by
Mvir. In Table 1 we
also list the thermal line widths for b1 and b2,
Δvth, obtained by assuming
Tkin = Texc (LTE). To derive
the total molecular mass of component 1 from the 13CO data we added up the
values obtained for a1, a2, and a3,
which yields a total mass M(H2)LTE ≈ 900
M⊙. Using the same technique with the values obtained for
b1 and b2 from the CO data, we derive total
molecular masses M(H2)X ≈ 5500
M⊙ and Mvir ≈ 16 000
M⊙.
is the effective radius in parsecs, and Δvcld is defined as
the FWHM line width of the composite profile derived by using a single Gaussian fitting.
The composite profile is obtained by averaging all the spectra within the area of the
cloud (Acloud). The uncertainties involved are about 40%,
mostly due to the estimates of R. In Table 1 we summarize some of the physical parameters detailed above,
obtained for the molecular clouds constituting component 1. The values of
N(H2)X and
M(H2)X are the hydrogen column
density and molecular mass, respectively, determined using Eq. (2), while
N(13CO)LTE and
M(H2)LTE are the 13CO column density
and molecular mass obtained by assuming LTE. The virialized mass is given by
Mvir. In Table 1 we
also list the thermal line widths for b1 and b2,
Δvth, obtained by assuming
Tkin = Texc (LTE). To derive
the total molecular mass of component 1 from the 13CO data we added up the
values obtained for a1, a2, and a3,
which yields a total mass M(H2)LTE ≈ 900
M⊙. Using the same technique with the values obtained for
b1 and b2 from the CO data, we derive total
molecular masses M(H2)X ≈ 5500
M⊙ and Mvir ≈ 16 000
M⊙.
It is worth pointing out that the physical parameters quoted in Table 1 are only derived for component 1, since is the only one entirely detected at 13CO emission and morphologically defined without ambiguity.
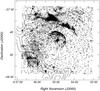 |
Fig. 3 CO integrated intensity in the velocity range from −9.5 km s-1 to −7.2 km s-1 (contours) superimposed onto the Hα emission (gray scale). The contour levels start at 0.8 K and the contour spacing is 0.55 K. |
Main physical parameters of the identified molecular clouds.
3.1.2. Component 2
In Fig. 3 we show the spatial distribution of the CO emission in the velocity interval from −9.5 km s-1 to −7.2 km s-1, overlaid on the Hα emission of the nebula. The molecular gas in this velocity interval shows a morphological correspondence with the outer Hα ring, especially at the intense optical emission at (RA, Dec)J2000 = (9h56m15s, –57°51′). This feature was not detected by Marston et al. (1999) due to the limited area covered by their CO data. It can be noted that this feature extends well beyond the area depicted in Fig. 3, which suggests that it is part of a larger structure, probably the previously reported extended CO plateau adjacent to component 1 (see Fig. 2b).
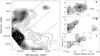 |
Fig. 4 Left panel: comparison between components 1 (contours) and 2 (gray scale). The location of the slices, labeled as a, b, and c, are sketched by the dotted lines. The cross at the center indicates the position of WR 16. Right panels: position-velocity maps obtained for strips a, b, and c. Contour levels start at 1.9 K and the contour spacing is 1.4 K. The loci of both components are indicated by the black arrows. |
In Fig. 4 we show the CO emission distribution of component 2 (grayscale) superimposed on that of component 1 (contours). A spatial separation between both components can be observed, with component 2 adjacent to the eastern border of the outer Hα ring, and component 1 placed almost at the interface between the latter and the Hα emission. The kinematic of the molecular gas was analyzed by position-velocity maps across selected strips. In the righthand panels of Fig. 4 we show the position-velocity diagrams in the directions sketched in the lefthand panel of the figure. Slices a to c show that the peak emission of both features are discernible and spatially separated by about ~7′. Both slices also show a weak bridge of CO emission that connects the western border of component 1 with the eastern side of component 2. Although this bridge might suggest a physical link between both features, no hints of a velocity gradient are detected. On the other hand, slice c shows a stronger CO emission bridge between the two features. However, the peak emission of both features are well separated by ~6′. Probably, the selected direction of slice b, along the stronger region of component 2, and the weaker region of component 1, makes their emissions look merged, although this may be a projection effect. The morphology and kinematical behavior of component 2 suggests that this feature is not the consequence of a mere velocity gradient, but is rather due to the presence of a second molecular structure. As suggested before, component 2 may be a small part of a larger molecular structure (plateau), whose extension likely exceeds the area depicted in Figs. 3 and 4. The double-layer morphology reported above for the molecular gas in the velocity range from ~–10 km s-1 to ~–3 km s-1 could be associated to some shock fronts and mass-loss rate episodes that have been acting upon the surrounding ISM, as predicted by the hydrodynamical models of Garcia-Segura et al. (1996a,b). Characteristics times of this features are discussed further in Sect. 4.2.
3.1.3. Component 3
In Fig. 5 we show an image ~16′ × 16′ in size centered on the position of WR16 that shows the CO emission in the velocity range from –9.59 km s-1 to –9.48 km s-1 (two channel maps), superimposed onto the Hα emission of the inner ring nebula.
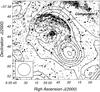 |
Fig. 5 Distribution of the mean CO emission in the velocity interval from –9.59 km s-1 to –9.48 km s-1 (contours), superimposed on the Hα emission (gray scale). The beam size of the CO observations is shown by a white circle in the lower left corner. The lowest temperature contour is 0.5 K (~4.5 rms). The contour spacing is ~0.65 K. |
Even though the intense CO clump located at (RA, Dec)J2000 = (9h55m30s, –57°47′30′′) stands out, a fainter ring-shaped molecular emission (indicated in the figure as component 3) surrounding the position of WR 16 is noticeable. The star is seen projected onto a well-defined minimum of the CO emission while the molecular gas ~3′ north of the star is coincident with the brightest Hα emission of the inner ring. The good morphological correspondence between the CO and the Hα emission may indicate a mutual physical association between the molecular and the ionized gas. It is worth mentioning that this feature was not detected by Marston et al. (1999), probably due to sensitivity or velocity resolution. However, we are cautious about reporting component 3 since the area is small and the CO observations are not fully sampled. Furthermore, we note the short velocity interval in which component 3 is noticeable. Further high-spatial resolution observations with instruments like APEX may help to clarify the nature and characteristics of this feature.
3.2. Radio continuum emission
To show the distribution of the ionized gas, we display in Fig. 6 the 4.85 GHz radio continuum emission image obtained from the PMN survey, overlaid onto the SHS Hα emission image of the nebula. As expected, both images show a relatively good morphological correspondence, since both emissions indicate the existence of ionized gas. Four radio continuum features are identified within the area observed at CO frequencies. Feature 1 peaks at (RA, Dec)J2000 ≈ (9h54m55s, –57°42′45′′) and has an arc-like morphology that is almost coincident with the brightest section of the inner ring nebula. Feature 2, peaking at (RA, Dec)J2000 ≈ 9h55m50s, –57°51′15′′), is placed alongside a relatively strong optical structure. The peak emission of Feature 3 (RA, Dec)J2000 ≈ (9h55m00s, –57°35′00′′) is coincident with the brightest section of the outer ring nebula. Unlike the other radio continuum features, Feature 4 is seen projected onto a weak optical emission. Its location and morphology suggest that this feature might be the radio continuum counterpart of the southwestern section of the outer ring nebula.
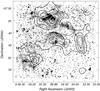 |
Fig. 6 Overlay of the radio continuum image at 4.85 GHz (contour lines) and the Hα image (gray scale). The lowest contour line is 28 mJy beam-1 (~3.5 rms), and the contour spacing is 50 mJy beam-1. |
In Table 2 we summarize some parameters of the
ionized gas estimated from the radio continuum flux densities at 4.85 GHz
(S4.85). Adopting an electron temperature of 104
K, assuming constant electron densities, and using the spherical models of Mezger & Henderson (1967) for Features 2 and 3,
and their cylindrical model for Features 1 and 4, we obtained the rms electron density
(ne) and the ionized mass (Mion)
for each feature. For S4.85 we estimate an error of about 20%.
Since no clumping factor was taken into account, the obtained values of
ne and Mion result in lower and
upper limits, respectively. To calculate the number of Lyman continuum photons needed to
keep the current level of ionization in the ring nebulae
(NLyc), we use the relation of Chaisson (1976).  (4)where
T4 is the electron temperature in units of 104 K,
ν is the frequency in units of GHz, d is the distance
in kpc, and Sν is the total flux density in
Jy. By summing up the values obtained for all the radio continuum features, we obtain
NLyc ≈ 1 × 1047 s-1. Considering that
the number of Lyman continuum photons emitted by a WN8 star is ~1.25 × 1049
s-1 (Crowther 2007), we therefore
conclude that WR 16 is by far capable of maintaining the observed ionization level.
(4)where
T4 is the electron temperature in units of 104 K,
ν is the frequency in units of GHz, d is the distance
in kpc, and Sν is the total flux density in
Jy. By summing up the values obtained for all the radio continuum features, we obtain
NLyc ≈ 1 × 1047 s-1. Considering that
the number of Lyman continuum photons emitted by a WN8 star is ~1.25 × 1049
s-1 (Crowther 2007), we therefore
conclude that WR 16 is by far capable of maintaining the observed ionization level.
Main parameters of the ionized gas in features 1, 2, 3, and 4.
4. Discussion
4.1. The molecular mass of component 1
In Sect. 3.1 we have derived the mass of the molecular clouds constituting component 1 making use of the CO and 13CO data by three different methods. In spite of their uncertainties, all three methods provide mass estimates for this feature that strongly suggest that most of the molecular gas has a nonstellar origin. We note that the total LTE mass obtained in this work (~900 M⊙) is substantially higher than what is obtained by Marston et al. (1999), although this difference may be due to the limited area covered by these authors.
According to the obtained values a remarkable result is noticed when comparing all three methods, namely Mvir > M(H2)X > M(H2)LTE. Regarding the total virialized mass, the derived value (~16 000 M⊙) was obtained assuming that only the gravitational and internal pressure support the stability of the cloud ignoring the effect of external pressure. Mass estimation methods, such as the Virial and CO integrated emission masses, depend on the line width, which are highly sensitive to cloud kinematics. Comparing masses estimated by these methods thus enables some analysis of turbulence and kinematics of the molecular gas. From Eqs. (2) and (3) it can be noted that Mvir/M(H2)X ∝ Δvcld/R. Therefore, molecular clouds having high line widths should exhibit high virialized mass in comparison with its integrated mass. This could be the case of component 1, since b1 and b2 exhibit line widths significantly higher than the predicted thermal width (see Table 1). This is not odd since the environs of a massive star are highly disturbed by strong stellar winds and violent shock fronts. The high value of Mvir with respect to M(H2)X indicates that component 1 has too much kinetic energy and is not in virial equilibrium. Very likely, the molecular gas of component 1 is supported by the external pressure provided by the warm and low density gas that is ionized by the strong UV radiation field of the WR star. The pressure needed to sustain the molecular gas could be provided by the ionized gas of the ring nebula trapping component 1.
The discrepancy between M(H2)X
and M(H2)LTE is harder to explain. The
X-factor was obtained empirically towards several molecular clouds in
the Galactic disk, and is believed to be accurate to a factor of 2, when averaged over a
large number of clouds. However, this factor can vary under conditions differing from
those of typical Galactic clouds, namely density, age, turbulence, cosmic ionization rate,
incident radiation field, and metallicity (Bell et al.
2006; Pineda et al. 2008; Shetty et al. 2011). The last two factors may have
played a major role in the environs of the star. In fact, these two factors are intimately
related since the formation of CO is sensitive to both the amount of available C and O and
the UV radiation field responsible for photodissociating molecules and regulating the CO
abundances. Increasing metallicity could strongly decrease the X-factor
below the canonical value, while a stronger radiation field could slightly raise it (Bell et al. 2006). The chemical abundance of the inner
ring nebula around WR 16 suggests that the close surroundings of the WR star have been
processed and enriched by molecular ejecta of previous LBV or RSG phases (Marston et al. 1999), which very likely dominates the
production of new CO despite its depletion by the ionizing radiation field of the star.
Then, component 1 may be actually composed of a mix of stellar ejecta and interstellar
molecular gas. This could mean that the X-factor used in Eq. (2) (1.6 × 1020 cm-2 (K
km s-1)-1) is high for this case, which creates some difference
between M(H2)X and
M(H2)LTE. In fact, this might also explain the
high ratio  (CO)/(13CO)
observed for component 2 (~9; see Table 1), which
is almost twice the average Galactic value. It is worth pointing out that turbulent
motions produce a slight drop in the value of X, although this effect is
not significant (Bell et al. 2006). Nevertheless, we
keep in mind that 13CO LTE-based mass estimates are also subject to their own
uncertainties and may underestimate the true column density by a factor up to 7 (Padoan et al. 2000).
(CO)/(13CO)
observed for component 2 (~9; see Table 1), which
is almost twice the average Galactic value. It is worth pointing out that turbulent
motions produce a slight drop in the value of X, although this effect is
not significant (Bell et al. 2006). Nevertheless, we
keep in mind that 13CO LTE-based mass estimates are also subject to their own
uncertainties and may underestimate the true column density by a factor up to 7 (Padoan et al. 2000).
The study of higher rotational levels of the CO could shed some light on the physical and excitation conditions of the molecular gas in the region. Furthermore, non-LTE analysis of these lines will help in obtaining more robust estimates of some physical parameters, such as the column density, mass, kinetic temperature, and opacities.
4.2. Dynamics of the molecular gas
In previous sections we detailed the characteristics of the molecular gas components projected onto the multiple ring nebula around WR 16. The good morphological correspondence between the CO and Hα emissions suggests a physical association between the molecular and the ionized gas.
The morphology of the molecular gas in the velocity range from ~–10 km s-1 to –3 km s-1 suggests that the ambient molecular gas in the vicinity of WR 16 could have been swept up by the action of shock-fronts and the strong stellar winds, giving rise to the features shown in Fig. 4. Assuming that the winds of the star are spherically symmetric and that component 1 and component 2 are two-dimensional projections of spherical expanding shells, a connected structure with the velocity should be manifested in the datacube, first as a blueshifted pole, then into a growing and decreasing circular ring, and finally to a redshifted pole, with the powering star placed at the center or close to it. However, according to our data none of these kinematical features are noticed, since no hints of a velocity gradient is detected. As we have pointed out, component 2 is very likely part of a larger molecular emission plateau that extends to the east (see Fig. 2). We infer that WR 16 is placed outside of or in an eccentric position with respect to this plateau, and is blowing the molecular gas from a side (face-on). Evidence of this kind of molecular structures has been found in the Galaxy (see Arce et al. 2011). The location of the brightest region of the outer ring nebula, almost in the opposite direction of components 1 and 2, suggests that this ring might be the remains of the parental molecular gas after having been ionized by the WR star and/or its progenitor. The molecular clump located at (RA, Dec)J2000 ≈ (9h54m, –57°33′) could be a remnant of the parental molecular gas (see Fig. 3).
As mentioned in Sect. 3.1, the stratified location and kinematics of components 1 and 2 (and probably component 3) are highly correlated with the multiple layer morphology of the nebula, and may indicate an evolution of the ISM associated with successive shock fronts, each one related to different evolutive episodes of the predecessors of WR 16. The different velocities of each component could have been produced by violent events related to the star evolution and the probable occurrence of mass eruptions, which combined with the strong stellar UV radiation field, have produced the Hα morphology and the observed kinematical features. Component 2 seems to be the more extended one. Its border is adjacent to the eastern border of the outer Hα ring. Probably this is the oldest one and it could represent the main-sequence signature of the star progenitor (see below). Component 1 is placed almost at the interface between component 2 and the Hα emission. It could be related to an intermediate phase prior to the actual WR stage, such as RSG or LBV (Marston et al. 1999). Finally, the location of component 3 is internal to the other two components, and its origin could be associated with a later stage.
The mentioned scenario is remarkably similar to one depicted by Rizzo et al. (2001b, 2003) for
NGC 2359. In that case, however, the main “fingerprint” of the previous O-stage was
revealed by the presence of an Hi shell expanding at 12 km s-1 that
shocked the molecular gas, accelerating it to a velocity of ~12−13 km s-1. In
order to test the proposed scenario a rough estimate of the dynamical age
(tdyn) of component 2 was made using
 (5)(Howarth & Lamers 1999). Here,
R is the averaged radius of component 2 (~9 pc at 2.3 kpc), and
Vexp is the expansion velocity. For
Vexp we consider a conservative range of values from ~5
km s-1 (Duronea et al. 2012) to ~12
km s-1 (Rizzo et al. 2003). Then, the
obtained values of tdyn are in the range
4−9 × 10⁵ yr. If we consider the 35 M⊙ model of
stellar evolution of Garcia-Segura et al. (1996b)
(O→RSG→WR), the duration of the O phase (4.5 × 10⁶ yr) is longer than
tdyn by a factor of ~5−10. On the other hand, taking the 60
M⊙ model of Langer et al.
(1994) (O → pre-LBV → LBV → WR) into account, the duration of the O phase is only
longer by a factor ~2−4. In either case, these differences could be explained in terms of
the small solid angle subtended by component 2 around WR 16 (see Fig. 3), which is not able to be impelled by the totality of the stellar wind
power. This scenario allows one to deal with the hypothesis by which the parental
molecular cloud around an evolved massive star is destroyed and/or evacuated after star
formation. It is worth pointing out that we have searched for Hi shells around WR
16, using available surveys, but with negative results. This reinforces the proposed
scenario of component 2 being blown-up by the O-star progenitor.
(5)(Howarth & Lamers 1999). Here,
R is the averaged radius of component 2 (~9 pc at 2.3 kpc), and
Vexp is the expansion velocity. For
Vexp we consider a conservative range of values from ~5
km s-1 (Duronea et al. 2012) to ~12
km s-1 (Rizzo et al. 2003). Then, the
obtained values of tdyn are in the range
4−9 × 10⁵ yr. If we consider the 35 M⊙ model of
stellar evolution of Garcia-Segura et al. (1996b)
(O→RSG→WR), the duration of the O phase (4.5 × 10⁶ yr) is longer than
tdyn by a factor of ~5−10. On the other hand, taking the 60
M⊙ model of Langer et al.
(1994) (O → pre-LBV → LBV → WR) into account, the duration of the O phase is only
longer by a factor ~2−4. In either case, these differences could be explained in terms of
the small solid angle subtended by component 2 around WR 16 (see Fig. 3), which is not able to be impelled by the totality of the stellar wind
power. This scenario allows one to deal with the hypothesis by which the parental
molecular cloud around an evolved massive star is destroyed and/or evacuated after star
formation. It is worth pointing out that we have searched for Hi shells around WR
16, using available surveys, but with negative results. This reinforces the proposed
scenario of component 2 being blown-up by the O-star progenitor.
The morphology and location of component 1 might lead one to assume that this feature is composed of molecular gas ejected by the star in a previous evolutionary phase. However, the molecular mass estimated in Sect. 3.1 led us to conclude that this component might be rather composed by a mix of shocked interstellar molecular gas and stellar ejecta from intermediate stages (RSG or LBV), probably as a result of the encounter of two winds (as suggested by Garcia-Segura et al. 1996a,b) impinging the interstellar molecular gas. The most likely scenario is the WR wind encountering an already stopped RSG/LBV wind in contact with the molecular cloud, and being abruptly decelerated giving rise to the observed shocked gas. The stellar ejecta has been probably accumulating at the inner edge of component 1, as proposed by Marston et al. (1999), where the WR wind is impacting and the UV field is ionizing, giving rise to the inner Hα ring. The velocity difference between components 1 and 2 (2−3 km s-1) would give a rough estimate of the velocity of the shock, although this is very likely a lower limit since we are observing projected radial velocities from a face-on geometry. The location of component 1 requires that the wind of the previous O-stage has not fully interacted with the ISM and could have partially run through the molecular gas. Indeed, this might be possible owing to the relatively low density of the O-stage winds. This argument is also discussed by Rizzo et al. (2003), and this scenario implies that only a fraction of the mechanical energy injected by the winds of the previous O-stage is converted into kinetic energy of the expanding molecular gas, which is in line with theoretical predictions (Koo & McKee 1992; Arthur 2007).
4.3. The inner ring
In this section we briefly discuss some aspects of the inner region of the nebula. In
their Fig. 8, Marston et al. (1999) show the
continuum 60 μm emission distribution around the star WR 16. The IRAS map
reveals a bright shell that has an excellent spatial correlation with the inner ring
nebula. No other external IR features are reported in the paper. This shell is also
detected in the HIRES IRAS 25 μm emission (see Fig. 9 of Marston et al. 1999). We analyzed the dust continuum
emission at 60 μm and 100 μm from IRAS high resolution
images (HIRES) to study the warm dust counterparts of the inner ring nebula. Following
Draine (1990) the dust temperature of the shell
was obtained using ![Mathematical equation: \begin{equation} \label{td} T_{\rm d}\ =\ 95.94/\textrm{ln} \left[ 1.667^{(3+n)} (F_{100}/F_{60}) \right] ~({\rm K}) \end{equation}](/articles/aa/full_html/2013/03/aa19816-12/aa19816-12-eq134.png) (6)where
F100 and F60 are the 100
μm and 60 μm IRAS fluxes. The parameter
n (assumed to be 1.5) is related to the absorption efficiency of the
dust. We obtained a dust temperature of about Td ≈ 28 K, which
is remarkably similar to what is found in the ring nebula NGC 2359 (Rizzo et al. 2001a). We also derived the dust mass of the shell using
(6)where
F100 and F60 are the 100
μm and 60 μm IRAS fluxes. The parameter
n (assumed to be 1.5) is related to the absorption efficiency of the
dust. We obtained a dust temperature of about Td ≈ 28 K, which
is remarkably similar to what is found in the ring nebula NGC 2359 (Rizzo et al. 2001a). We also derived the dust mass of the shell using
 (7)(Tokunaga 2000), where d the distance
in pc, and F100 is given in Jy. We obtain a dust mass of ~0.1
M⊙ with an uncertainty of ~45%. By assuming a standard
gas-to-dust ratio of ~100, and taking an ionized gas of ~4 M⊙
into account (see Sect. 3.2), a molecular gas component of ~6
M⊙ in mass is predicted to be associated with the dust shell
around the WR star, which could explain the presence of component 3.
(7)(Tokunaga 2000), where d the distance
in pc, and F100 is given in Jy. We obtain a dust mass of ~0.1
M⊙ with an uncertainty of ~45%. By assuming a standard
gas-to-dust ratio of ~100, and taking an ionized gas of ~4 M⊙
into account (see Sect. 3.2), a molecular gas component of ~6
M⊙ in mass is predicted to be associated with the dust shell
around the WR star, which could explain the presence of component 3.
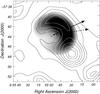 |
Fig. 7 Overlay of the mean CO line (contours) in the velocity range from –9.59 km s-1 to –9.48 km s-1, and HIRES 60 μm emission (gray scale) smoothed down to a beam of 27. Dashed and solid arrows indicate the direction of the proper motion derived by Moffat et al. (1998, 1999) and in this work, respectively. |
In Fig. 7 we show an overlay of the mean CO line emission in a velocity range −9.59 km s-1 to −9.48 km s-1 (component 3) onto the HIRES 60 μm emission, which has been smoothed down to a common beam of 27. A look at this figure shows that the 60 μm and molecular emission are asymmetrical, having most of their emission toward the north western section. The same behavior is observed for the optical and the radio continuum emissions (see Figs. 1 and 6). Using proper motions obtained from the Hipparcos astrometry satellite (ESA 1997) Moffat et al. (1998, 1999) concluded that WR 16 is a candidate star for be a runaway. The direction of the peculiar tangential proper motion of WR 16 (according to Moffat et al. 1998, 1999) is shown in Fig. 7. Following Moffat et al. (1998, 1999) but using the Tycho-2 Catalogue (Hog et al. 2000) we derived for WR 16 a new direction of the peculiar tangential velocity (μl,pec, μb,pec)with respect to its local ISM. Adopting observed proper motions of μαcos(δ) = (–6.8 ± 1.4) mas yr-1and μδ = (5 ± 1.4) mas yr-1, we derived (μl,pec, μb,pec)= (–12.1 ± 1.1) mas yr-1, (–3.5 ± 2.6) mas yr-1. The direction of the peculiar proper motion computed in this way is depicted in Fig. 7. Our results confirm those of Moffat et al. (1999) and very likely suggest that the strengthening in the IR, radio-continuum, optical, and probably molecular emission may be caused by the motion of the WR star with respect to the ISM (“bow shock”).
From all the explained above, it becomes clear there is a need for better evolutionary models that may explain the existence of dust and molecular gas at such a close distance to a WR star. However, as pointed out in Sect. 3.1, it is important to stress that the existence of component 3 is still to be confirmed by high-spatial resolution and sensitive observations.
5. Concluding remarks
We have performed a study of the molecular gas in the multiple ring nebula associated with the WN8 star WR 16. In this work, NANTEN CO J = 1 → 0 and 13CO J = 1 → 0 observations were used, together with 4.85 GHz radio continuum data retrieved from the PMNRAO Southern Radio Survey and IRAS (HIRES) archival data.
The new CO and 13CO data allowed us to map all of the molecular gas surrounding the star WR 16. We reported two molecular features at velocities of −5 km s-1 (component 1) and −8.5 km s-1 (component 2). For component 1 we derived a molecular mass ≳900 M⊙, which indicates that is mostly composed of interstellar gas. We also find that Mvir > M(H2)X > M(H2)LTE which suggests that this feature is probably bounded by the external pressure of the ionized gas, and is enriched by stellar molecular ejecta. The morphological and kinematical stratifications of the molecular gas in the velocity range from ~−10 km s-1 to −3 km s-1 is indicative of an evolution of the surrounding molecular gas with successive events associated with the evolution of the WR star. Based on our findings, we suggest that WR 16 could have been located close to the edge, or outside of a large molecular structure. The winds of the progenitor O-star could be responsible for the formation of component 2, blowing part of the molecular gas surrounding the star. The rest of the molecular gas was first impacted by the winds of previous RSG or LBV phase, and later by the WR winds, which created a shock front, and the kinematical features observed in the CO emission.
The 4.85 GHz emission shows a relatively good morphological correspondence with the optical nebula. The derived electron densities are about 16 cm-3 for the inner nebula and 8−10 cm-3 for the outer nebula. The total ionized gas is ~36 M⊙.
The dust shell around WR 16 reported by Marston et al. (1999) was studied using HIRES IRAS 60 μm and 100 μm. We determined a dust temperature and mass of about 28 K and 0.1 M⊙, respectively. We also reported a third molecular feature at −9.5 km s-1 (component 3), having a good morphological correlation with the dust continuum emission at 60 μm and with the Hα emission, which has to be confirmed with high resolution observations. The asymmetry of the discovered structures may also be qualitatively explained by the motion of the massive star.
Radial velocities are referred to the local standard of rest (LSR).
Acknowledgments
We especially thank Prof. Takahiro Hayakawa, Prof. Yasuo Fukui, and Prof. Takeshi Okuda for making their 13CO J = 1 → 0 data available to us. We very much acknowledge the anonymous referee for her/his helpful comments and suggestions that led to the improvement of this paper. We greatly appreciate the hospitality of all staff members of Las Campanas Observatory of the Carnegie Institute of Washington, and all members of the NANTEN staff, in particular Prof. Yasuo Fukui, Dr. Toshikazu Onishi, Dr. Akira Mizuno, and students Y. Moriguchi, H. Saito, and S Sakamoto. We also would like to thank Dr. D. Miniti (Pontífica Universidad Católica, Chile) and Mr. F. Bareilles (IAR) for their involvement in early stages of this project. This project was partially financed by the Consejo Nacional de Investigaciones Científicas y Técnicas (CONICET) of Argentina under projects PIP 112-200801-01299, Universidad Nacional de La Plata (UNLP) under project 11G/091, Agencia Nacional de Promoción Cientíca y Tecnológica (ANPCYT) under project PICT 14018/03, and CONICYT Proyect PFB06.
References
- Arce, H. G., Borkin, M. A., Goodman, A. A., Pineda, J. E., & Beaumont, C. N. 2011, ApJ, 742, 105 [NASA ADS] [CrossRef] [Google Scholar]
- Arnal, E. M. 1992, A&A, 254, 305 [NASA ADS] [Google Scholar]
- Arnal, E. M., Cappa, C. E., Rizzo, J. R., & Cichowolski, S. 1999, AJ, 118, 1798 [NASA ADS] [CrossRef] [Google Scholar]
- Arthur, S. J. 2007, Wind-Blown Bubbles around Evolved Stars, eds. T. W. Hartquist, J. M. Pittard, & S. A. E. G. Falle, 183 [Google Scholar]
- Bell, T. A., Roueff, E., Viti, S., & Williams, D. A. 2006, MNRAS, 371, 1865 [NASA ADS] [CrossRef] [Google Scholar]
- Bertsch, D. L., Dame, T. M., Fichtel, C. E., et al. 1993, ApJ, 416, 587 [NASA ADS] [CrossRef] [Google Scholar]
- Bloemen, J. B. G. M., Strong, A. W., Mayer-Hasselwander, H. A., et al. 1986, A&A, 154, 25 [NASA ADS] [Google Scholar]
- Brand, J., & Blitz, L. 1993, A&A, 275, 67 [NASA ADS] [Google Scholar]
- Burton, W. B., & Gordon, M. A. 1978, A&A, 63, 7 [NASA ADS] [Google Scholar]
- Cappa, C. E., Niemela, V. S., Herbstmeier, U., & Koribalski, B. 1996, A&A, 312, 283 [NASA ADS] [Google Scholar]
- Cappa, C. E., Rubio, M., & Goss, W. M. 2001, AJ, 121, 2664 [NASA ADS] [CrossRef] [Google Scholar]
- Castor, J., McCray, R., & Weaver, R. 1975, ApJ, 200, L107 [NASA ADS] [CrossRef] [Google Scholar]
- Chaisson, E. J. 1976, in Frontiers of Astrophysics, ed. E. H. Avrett, 259 [Google Scholar]
- Chu, Y.-H. 1981, ApJ, 249, 195 [NASA ADS] [CrossRef] [Google Scholar]
- Chu, Y.-H., & Treffers, R. R. 1981a, ApJ, 249, 586 [NASA ADS] [CrossRef] [Google Scholar]
- Chu, Y.-H., & Treffers, R. R. 1981b, ApJ, 250, 615 [NASA ADS] [CrossRef] [Google Scholar]
- Chu, Y.-H., Troland, T. H., Gull, T. R., Treffers, R. R., & Kwitter, K. B. 1982, ApJ, 254, 562 [NASA ADS] [CrossRef] [Google Scholar]
- Condon, J. J., Griffith, M. R., & Wright, A. E. 1993, AJ, 106, 1095 [NASA ADS] [CrossRef] [Google Scholar]
- Conti, P. S., & Vacca, W. D. 1990, AJ, 100, 431 [Google Scholar]
- Crowther, P. A. 2007, ARA&A, 45, 177 [NASA ADS] [CrossRef] [Google Scholar]
- Dickman, R. L. 1978, ApJS, 37, 407 [NASA ADS] [CrossRef] [Google Scholar]
- Digel, S. W., Grenier, I. A., Heithausen, A., Hunter, S. D., & Thaddeus, P. 1996, ApJ, 463, 609 [NASA ADS] [CrossRef] [Google Scholar]
- Draine, B. T. 1990, in The Interstellar Medium in Galaxies, eds. H. A. Thronson Jr., & J. M. Shull, Astrophys. Space Sci. Lib., 161, 483 [Google Scholar]
- Duronea, N. U., Arnal, E. M., & Testori, J. C. 2012, A&A, 540, A121 [NASA ADS] [CrossRef] [EDP Sciences] [Google Scholar]
- Dyson, J. E. 1977, A&A, 59, 161 [NASA ADS] [Google Scholar]
- ESA. 1997, VizieR Online Data Catalog, I/239 [Google Scholar]
- Fowler, J. W., & Aumann, H. H. 1994, in Science with High Spatial Resolution Far-Infrared Data, eds. S. Terebey, & J. M. Mazzarella, 1 [Google Scholar]
- Garcia-Segura, G., & Mac Low, M.-M. 1995a, ApJ, 455, 145 [NASA ADS] [CrossRef] [Google Scholar]
- Garcia-Segura, G., & Mac Low, M.-M. 1995b, ApJ, 455, 160 [NASA ADS] [CrossRef] [Google Scholar]
- Garcia-Segura, G., Langer, N., & Mac Low, M.-M. 1996a, A&A, 316, 133 [NASA ADS] [Google Scholar]
- Garcia-Segura, G., Mac Low, M.-M., & Langer, N. 1996b, A&A, 305, 229 [NASA ADS] [Google Scholar]
- Hog, E., Fabricius, C., Makarov, V. V., et al. 2000, VizieR Online Data Catalog, I/259 [Google Scholar]
- Howarth, I., & Lamers, H. J. G. 1999, J. British Astron. Association, 109, 347 [NASA ADS] [Google Scholar]
- Hunter, S. D., Bertsch, D. L., Catelli, J. R., et al. 1997, ApJ, 481, 205 [NASA ADS] [CrossRef] [Google Scholar]
- Koo, B.-C., & McKee, C. F. 1992, ApJ, 388, 93 [NASA ADS] [CrossRef] [Google Scholar]
- Kutner, M. L., & Ulich, B. L. 1981, ApJ, 250, 341 [NASA ADS] [CrossRef] [Google Scholar]
- Langer, W. D., & Penzias, A. A. 1993, ApJ, 408, 539 [NASA ADS] [CrossRef] [Google Scholar]
- Langer, N., Hamann, W.-R., Lennon, M., et al. 1994, A&A, 290, 819 [NASA ADS] [Google Scholar]
- MacLaren, I., Richardson, K. M., & Wolfendale, A. W. 1988, ApJ, 333, 821 [NASA ADS] [CrossRef] [Google Scholar]
- Marston, A. P., Chu, Y.-H., & Garcia-Segura, G. 1994, ApJS, 93, 229 [NASA ADS] [CrossRef] [Google Scholar]
- Marston, A. P., Welzmiller, J., Bransford, M. A., Black, J. H., & Bergman, P. 1999, ApJ, 518, 769 [NASA ADS] [CrossRef] [Google Scholar]
- Mezger, P. G., & Henderson, A. P. 1967, ApJ, 147, 471 [NASA ADS] [CrossRef] [Google Scholar]
- Moffat, A. F. J., Marchenko, S. V., Seggewiss, W., et al. 1998, A&A, 331, 949 [NASA ADS] [Google Scholar]
- Moffat, A. F. J., Marchenko, S. V., Seggewiss, W., et al. 1999, A&A, 345, 321 [NASA ADS] [Google Scholar]
- Moriguchi, Y., Yamaguchi, N., Onishi, T., Mizuno, A., & Fukui, Y. 2001, PASJ, 53, 1025 [NASA ADS] [CrossRef] [Google Scholar]
- Padoan, P., Juvela, M., Bally, J., & Nordlund, Å. 2000, ApJ, 529, 259 [NASA ADS] [CrossRef] [Google Scholar]
- Parker, Q. A., Phillipps, S., Pierce, M. J., et al. 2005, MNRAS, 362, 689 [NASA ADS] [CrossRef] [Google Scholar]
- Penzias, A. A., & Burrus, C. A. 1973, ARA&A, 11, 51 [NASA ADS] [CrossRef] [Google Scholar]
- Pineda, J. E., Caselli, P., & Goodman, A. A. 2008, ApJ, 679, 481 [NASA ADS] [CrossRef] [Google Scholar]
- Rizzo, J. R., Martín-Pintado, J., & Henkel, C. 2001a, ApJ, 553, L181 [NASA ADS] [CrossRef] [Google Scholar]
- Rizzo, J. R., Martín-Pintado, J., & Mangum, J. G. 2001b, A&A, 366, 146 [NASA ADS] [CrossRef] [EDP Sciences] [Google Scholar]
- Rizzo, J. R., Martín-Pintado, J., & Desmurs, J.-F. 2003, A&A, 411, 465 [NASA ADS] [CrossRef] [EDP Sciences] [Google Scholar]
- Shetty, R., Glover, S. C., Dullemond, C. P., & Klessen, R. S. 2011, MNRAS, 412, 1686 [NASA ADS] [CrossRef] [MathSciNet] [Google Scholar]
- Solomon, P. M., Rivolo, A. R., Barrett, J., & Yahil, A. 1987, ApJ, 319, 730 [NASA ADS] [CrossRef] [Google Scholar]
- Strong, A. W., & Mattox, J. R. 1996, A&A, 308, L21 [NASA ADS] [Google Scholar]
- Tokunaga, A. T. 2000, Infrared Astron., ed. A. N. Cox, 143 [Google Scholar]
- Ulich, B. L., & Haas, R. W. 1976, ApJS, 30, 247 [NASA ADS] [CrossRef] [Google Scholar]
- van der Hucht, K. A. 2001, New Astron. Rev., 45, 135 [NASA ADS] [CrossRef] [Google Scholar]
- Weaver, R., McCray, R., Castor, J., Shapiro, P., & Moore, R. 1977, ApJ, 218, 377 [NASA ADS] [CrossRef] [Google Scholar]
- Yamaguchi, N., Mizuno, N., Saito, H., et al. 1999, PASJ, 51, 775 [NASA ADS] [Google Scholar]
All Tables
All Figures
|
Fig. 1 Super Cosmos Hα image of the ring nebula around WR 16. |
| In the text | |
|
Fig. 2 Distribution of the mean CO emission integrated in the velocity range from −7.2 km s-1 to −3.2 km s-1. The beam size of the CO observations is shown by a white circle in the lower left corner of each image. The position of WR 16 is marked by a plus sign at the center of each image. a) Emission distribution of the 13CO J = 1 → 0. The lowest temperature contour is 0.16 K (~5 rms). The contour-spacing temperature is 0.08 K till 0.48 K, and here onwards the contour spacing is 0.35 K. b) Emission distribution of the CO J = 1 → 0. The lowest temperature contour is 0.8 K (~10 rms) and the contour-spacing temperature is 0.7 K. c) Overlay of the mean CO emission in the velocity range from −7.2 km s-1 to −3.2 km s-1 (contours) and the Hα emission (gray scale) in the central region. Contour levels are the same as in Fig. 2b. |
| In the text | |
|
Fig. 3 CO integrated intensity in the velocity range from −9.5 km s-1 to −7.2 km s-1 (contours) superimposed onto the Hα emission (gray scale). The contour levels start at 0.8 K and the contour spacing is 0.55 K. |
| In the text | |
|
Fig. 4 Left panel: comparison between components 1 (contours) and 2 (gray scale). The location of the slices, labeled as a, b, and c, are sketched by the dotted lines. The cross at the center indicates the position of WR 16. Right panels: position-velocity maps obtained for strips a, b, and c. Contour levels start at 1.9 K and the contour spacing is 1.4 K. The loci of both components are indicated by the black arrows. |
| In the text | |
|
Fig. 5 Distribution of the mean CO emission in the velocity interval from –9.59 km s-1 to –9.48 km s-1 (contours), superimposed on the Hα emission (gray scale). The beam size of the CO observations is shown by a white circle in the lower left corner. The lowest temperature contour is 0.5 K (~4.5 rms). The contour spacing is ~0.65 K. |
| In the text | |
|
Fig. 6 Overlay of the radio continuum image at 4.85 GHz (contour lines) and the Hα image (gray scale). The lowest contour line is 28 mJy beam-1 (~3.5 rms), and the contour spacing is 50 mJy beam-1. |
| In the text | |
|
Fig. 7 Overlay of the mean CO line (contours) in the velocity range from –9.59 km s-1 to –9.48 km s-1, and HIRES 60 μm emission (gray scale) smoothed down to a beam of 27. Dashed and solid arrows indicate the direction of the proper motion derived by Moffat et al. (1998, 1999) and in this work, respectively. |
| In the text | |
Current usage metrics show cumulative count of Article Views (full-text article views including HTML views, PDF and ePub downloads, according to the available data) and Abstracts Views on Vision4Press platform.
Data correspond to usage on the plateform after 2015. The current usage metrics is available 48-96 hours after online publication and is updated daily on week days.
Initial download of the metrics may take a while.