Fig. 2
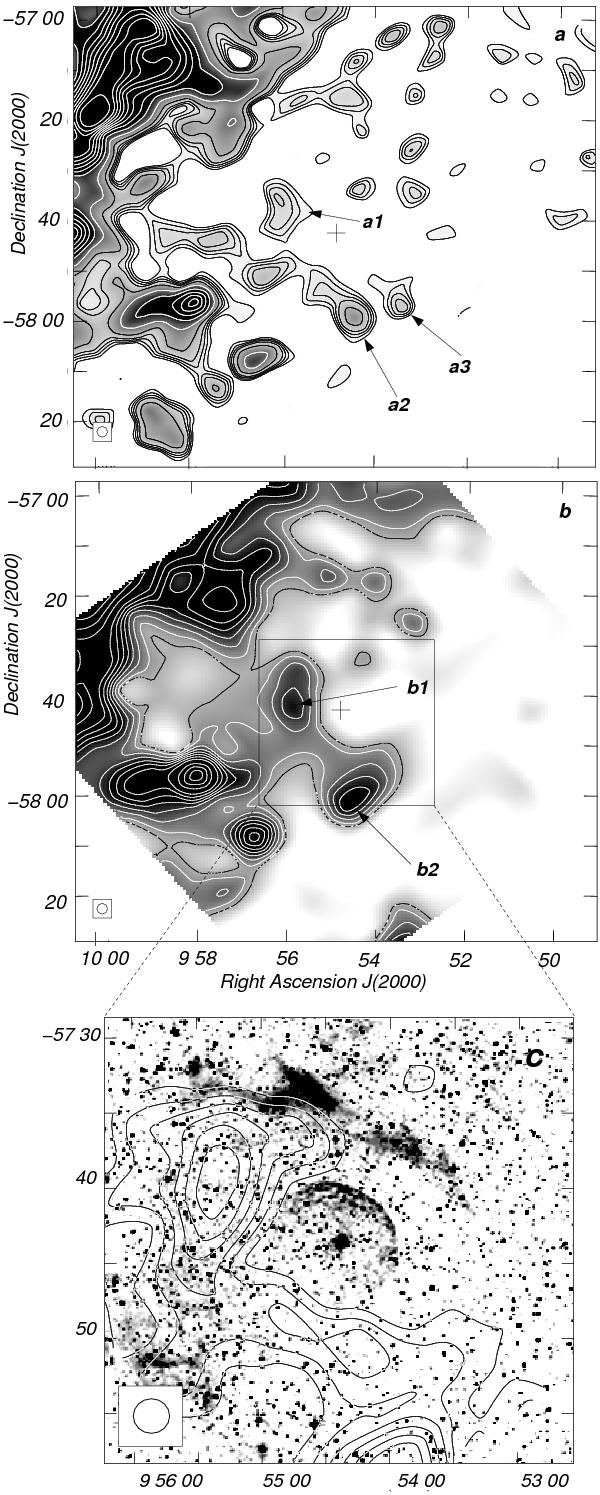
Distribution of the mean CO emission integrated in the velocity range from −7.2 km s-1 to −3.2 km s-1. The beam size of the CO observations is shown by a white circle in the lower left corner of each image. The position of WR 16 is marked by a plus sign at the center of each image. a) Emission distribution of the 13CO J = 1 → 0. The lowest temperature contour is 0.16 K (~5 rms). The contour-spacing temperature is 0.08 K till 0.48 K, and here onwards the contour spacing is 0.35 K. b) Emission distribution of the CO J = 1 → 0. The lowest temperature contour is 0.8 K (~10 rms) and the contour-spacing temperature is 0.7 K. c) Overlay of the mean CO emission in the velocity range from −7.2 km s-1 to −3.2 km s-1 (contours) and the Hα emission (gray scale) in the central region. Contour levels are the same as in Fig. 2b.
Current usage metrics show cumulative count of Article Views (full-text article views including HTML views, PDF and ePub downloads, according to the available data) and Abstracts Views on Vision4Press platform.
Data correspond to usage on the plateform after 2015. The current usage metrics is available 48-96 hours after online publication and is updated daily on week days.
Initial download of the metrics may take a while.