Fig. 4
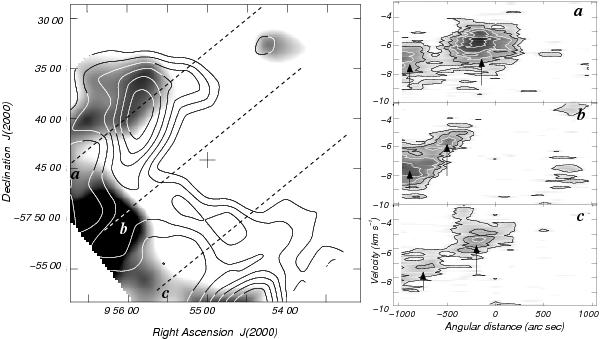
Left panel: comparison between components 1 (contours) and 2 (gray scale). The location of the slices, labeled as a, b, and c, are sketched by the dotted lines. The cross at the center indicates the position of WR 16. Right panels: position-velocity maps obtained for strips a, b, and c. Contour levels start at 1.9 K and the contour spacing is 1.4 K. The loci of both components are indicated by the black arrows.
Current usage metrics show cumulative count of Article Views (full-text article views including HTML views, PDF and ePub downloads, according to the available data) and Abstracts Views on Vision4Press platform.
Data correspond to usage on the plateform after 2015. The current usage metrics is available 48-96 hours after online publication and is updated daily on week days.
Initial download of the metrics may take a while.