Free Access
Fig. 10
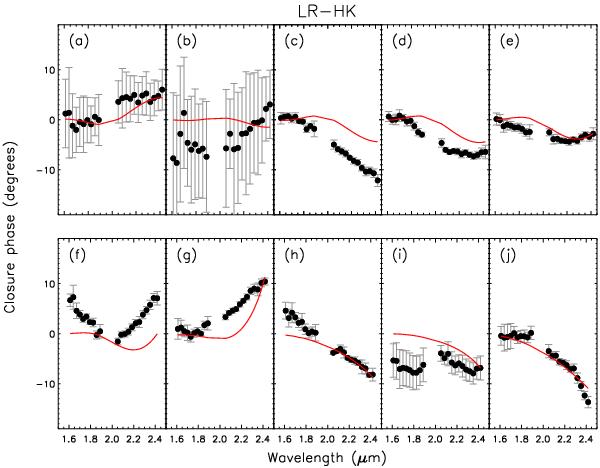
Low-resolution (LR-HK) closure phase measurements of HR 4049. Each panel refers to a baseline triangle. The letter in the top corner refers to the corresponding entry in Table 1. Measurements are indicated by black dots with error bars; the red line represents the model.
Current usage metrics show cumulative count of Article Views (full-text article views including HTML views, PDF and ePub downloads, according to the available data) and Abstracts Views on Vision4Press platform.
Data correspond to usage on the plateform after 2015. The current usage metrics is available 48-96 hours after online publication and is updated daily on week days.
Initial download of the metrics may take a while.