Fig. 9
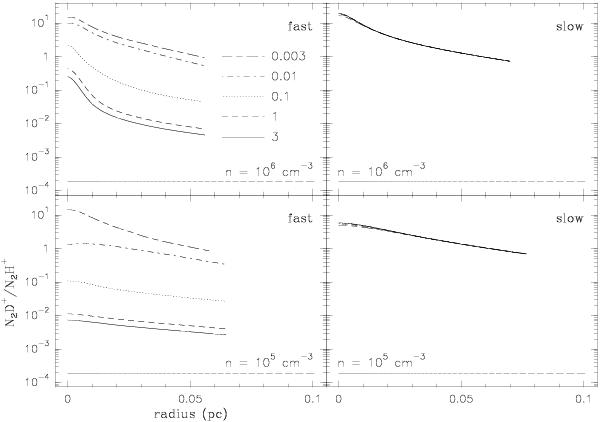
Evolution of the N2D+/N2H+ ratio with the H2 OPR values at the beginning of core contraction for the slow (right) and fast (left) models. The bottom row corresponds to the density profile with peak density of 105 cm-3 and the top row to the profile with peak density of 2 × 106 cm-3 (from Fig. 2). Initial OPR values are listed in the top left image. The full lines (OPR = 3) also trace the reference results (from Fig. 5).
Current usage metrics show cumulative count of Article Views (full-text article views including HTML views, PDF and ePub downloads, according to the available data) and Abstracts Views on Vision4Press platform.
Data correspond to usage on the plateform after 2015. The current usage metrics is available 48-96 hours after online publication and is updated daily on week days.
Initial download of the metrics may take a while.