Fig. 6
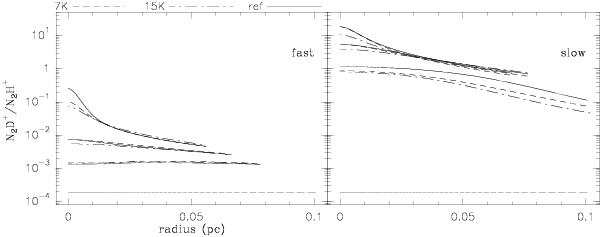
Evolution of the N2D+/N2H+ ratio with temperature for the slow (right) and fast (left) models. In the reference model, the temperature of the chemical network is the temperature of the gas. The two other cases are for constant temperature imposed on the chemical network. To see the differences better, the reference model has been drawn with the full line mode (from respectively the slow and fast cases displayed in Fig. 5).
Current usage metrics show cumulative count of Article Views (full-text article views including HTML views, PDF and ePub downloads, according to the available data) and Abstracts Views on Vision4Press platform.
Data correspond to usage on the plateform after 2015. The current usage metrics is available 48-96 hours after online publication and is updated daily on week days.
Initial download of the metrics may take a while.