Fig. 5
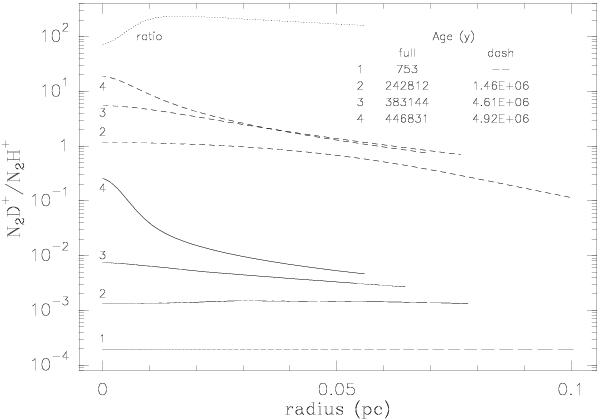
Evolution of the N2D+/N2H+ ratio with time for the slow (dashed lines) and fast (full lines) models. The dotted line traces the slow/fast ratio for the last epoch (corresponding to a peak density of 2 × 106 cm-3). The results are traced for the same density profiles as those in Fig. 2.
Current usage metrics show cumulative count of Article Views (full-text article views including HTML views, PDF and ePub downloads, according to the available data) and Abstracts Views on Vision4Press platform.
Data correspond to usage on the plateform after 2015. The current usage metrics is available 48-96 hours after online publication and is updated daily on week days.
Initial download of the metrics may take a while.