Fig. 11
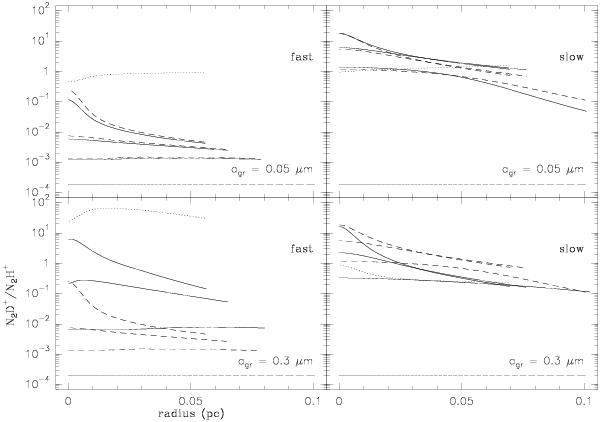
Evolution of the N2D+/N2H+ ratio when the grain size is multiplied by 3 (bottom row) or divided by 2 (top row) for the slow (right) and fast (left) models. The dashed lines trace the reference results (from Fig. 5). The dotted line traces the new versus reference model ratio for the last epoch (corresponding to a peak density of 2 × 106 cm-3) in each frame.
Current usage metrics show cumulative count of Article Views (full-text article views including HTML views, PDF and ePub downloads, according to the available data) and Abstracts Views on Vision4Press platform.
Data correspond to usage on the plateform after 2015. The current usage metrics is available 48-96 hours after online publication and is updated daily on week days.
Initial download of the metrics may take a while.