Fig. 6
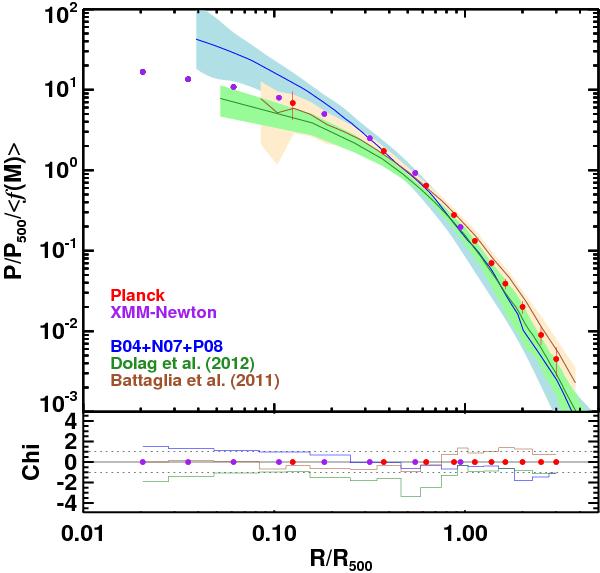
Measured pressure profiles from Planck and XMM-Newton, displayed as in Fig. 4. The three shaded areas mark the dispersions about the average profiles for three samples of simulated clusters: in blue, the simulations from Borgani et al. (2004), Nagai et al. (2007a) and Piffaretti & Valdarnini (2008), which were used in A10 to derive the universal pressure profile together with the REXCESS data; in green, the simulated sample of clusters from Dolag (in prep.); and in brown the simulated clusters from Battaglia et al. (2012). The corresponding average profiles for each set of simulations are plotted as solid lines using the same colour scheme. In the bottom panel, we present the χ profiles between the observed profile and the simulated average profiles, taking into account their associated dispersion. See Sect. 6.2 for more details.
Current usage metrics show cumulative count of Article Views (full-text article views including HTML views, PDF and ePub downloads, according to the available data) and Abstracts Views on Vision4Press platform.
Data correspond to usage on the plateform after 2015. The current usage metrics is available 48-96 hours after online publication and is updated daily on week days.
Initial download of the metrics may take a while.