Fig. 3
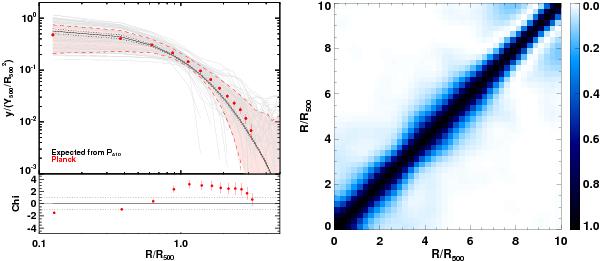
Left: individual profiles (grey lines) and scaled stacked profile (red points) for our sample of 62 clusters. The light-red shaded area marks the dispersion about the average stacked profile, with its upper and lower limits highlighted by the two dashed red lines. The points within each individual profile are correlated at about the 20% level (see Sect. 4.3.1). The error bars on the Planck data points are purely statistical and correspond to the square root of the diagonal elements of the covariance matrix. The solid black line (labeled in the legend as “Expected from PA10”) is the average stacked profile obtained from the expected SZ individual profiles drawn from the universal pressure profile of A10, parameterised according R500 and Y500 derived from the XMM-Newton data analysis presented in Planck Collaboration (2011f). The two dotted black lines indicate the associated dispersion about this model profile. The bottom panel shows the value of χ at each point with respect to the expectations from the universal profile taking into account the measured errors. Right: matrix of the correlation coefficient for the observed radial stacked profiles. Both panels are illustrated here for the MILCA results.
Current usage metrics show cumulative count of Article Views (full-text article views including HTML views, PDF and ePub downloads, according to the available data) and Abstracts Views on Vision4Press platform.
Data correspond to usage on the plateform after 2015. The current usage metrics is available 48-96 hours after online publication and is updated daily on week days.
Initial download of the metrics may take a while.