Fig. C.1
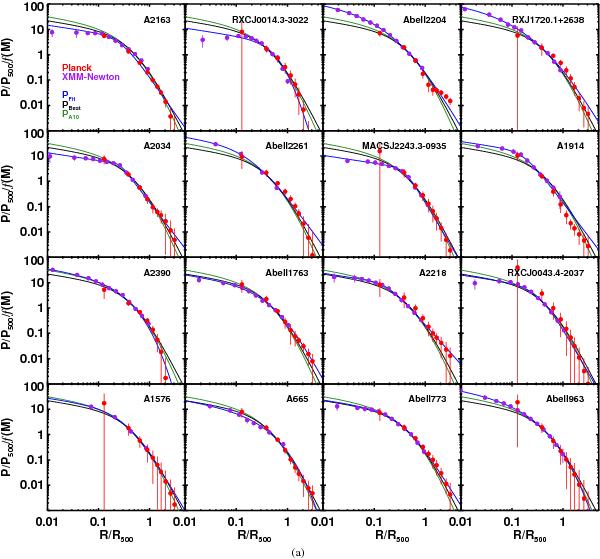
Measured individual pressure profiles for the ESZ-XMM sample using the Planck and XMM-Newton data. As for the stacked pressure profile, the maximum difference point-to-point between the three SZ reconstruction methods have been taken into account in the Planck measurement error budget (Sect. 6.3). The best fit model on each individual profile is shown as a blue solid line. The black and green solid curves mark the best fit model to the stacked SZ+X-ray pressure profile (Sect. 6.2) and the A10 best fit model, respectively.
Current usage metrics show cumulative count of Article Views (full-text article views including HTML views, PDF and ePub downloads, according to the available data) and Abstracts Views on Vision4Press platform.
Data correspond to usage on the plateform after 2015. The current usage metrics is available 48-96 hours after online publication and is updated daily on week days.
Initial download of the metrics may take a while.