Fig. 1
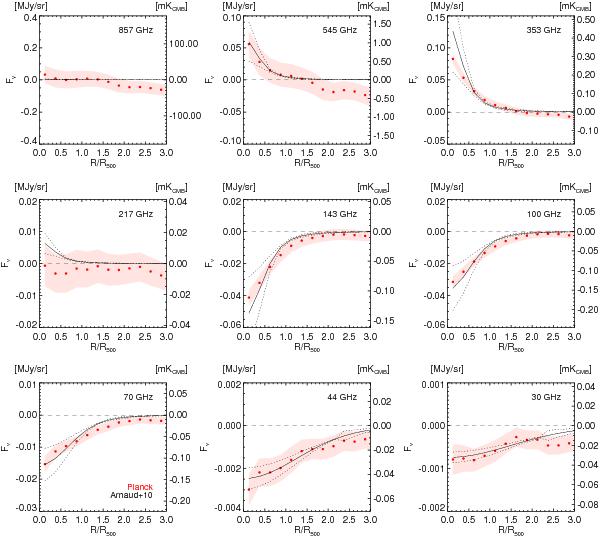
Average scaled SZ profiles for each of the nine Planck frequency bands (decreasing frequency from left to right and from top to bottom). The points within each individual profile are correlated at about the 20% level (see Sect. 4.3.1). At each frequency, the stacked radial profile is obtained from the average of the 62 individual cluster profiles scaled by R500 and Φi/ ⟨ Φi ⟩ , in the x- and y-axis directions, respectively (see Sect. 5.1). The light-red shaded area in each panel indicates the statistical uncertainty about the average observed profile. The solid black line corresponds to the prediction of the universal pressure profile (A10) for our cluster sample in each band, and the two dashed lines indicate its associated dispersion.
Current usage metrics show cumulative count of Article Views (full-text article views including HTML views, PDF and ePub downloads, according to the available data) and Abstracts Views on Vision4Press platform.
Data correspond to usage on the plateform after 2015. The current usage metrics is available 48-96 hours after online publication and is updated daily on week days.
Initial download of the metrics may take a while.