Fig. 9
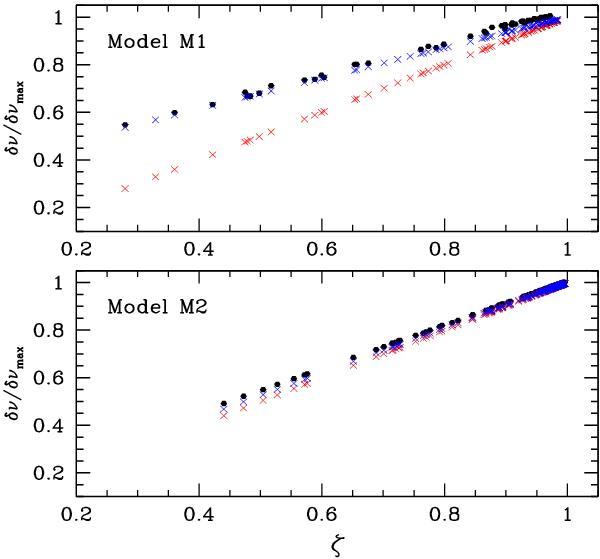
The rotational splitting normalized to its maximum value as a function of ζ (black dots) for model M1 (top) and model M2 (bottom). The red crosses represent the approximation δν/δνmax = ζ as a function of ζ. The blue crosses represent the approximation δν/δνmax = ζ(1 − 2ℛ) + 2ℛ as a function of ζ with R = 0.1785 and using numerical values of ζ.
Current usage metrics show cumulative count of Article Views (full-text article views including HTML views, PDF and ePub downloads, according to the available data) and Abstracts Views on Vision4Press platform.
Data correspond to usage on the plateform after 2015. The current usage metrics is available 48-96 hours after online publication and is updated daily on week days.
Initial download of the metrics may take a while.