Fig. 4
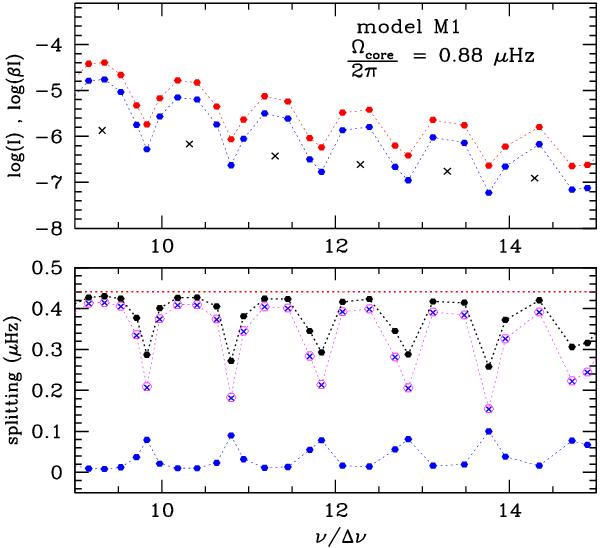
Top: integrated kernel (β I) with β and I given by Eqs. (13) and (8) respectively, (blue dotted line, dots correspond to modes) and mode inertia I (red dotted line, dots correspond to modes) in decimal logarithm for model M1. Black crosses represent the inertia of radial modes. Bottom: rotational splittings (Eq. (11)), in μHz, for ℓ = 1 modes as a function of the normalized frequency ν/Δν for M1 (black dots connected by a dotted line). The magenta open dots connected with the magenta dotted line represents the core contribution to the rotational splittings ⟨ Ω ⟩ coreβcore (Eqs. (15) and (18)). The core contribution to the rotational splittings (Eq. (15)) with ⟨ Ω ⟩ core computed with the horizontal eigenfunction z2 alone is displayed with the blue crosses dotted line. The blue dotted line represents the contribution from the envelope to the rotational splittings ⟨ Ω ⟩ env (β − βcore). The value ⟨ Ω ⟩ core/4π is drawn with the horizontal red dotted line.
Current usage metrics show cumulative count of Article Views (full-text article views including HTML views, PDF and ePub downloads, according to the available data) and Abstracts Views on Vision4Press platform.
Data correspond to usage on the plateform after 2015. The current usage metrics is available 48-96 hours after online publication and is updated daily on week days.
Initial download of the metrics may take a while.