Fig. 10
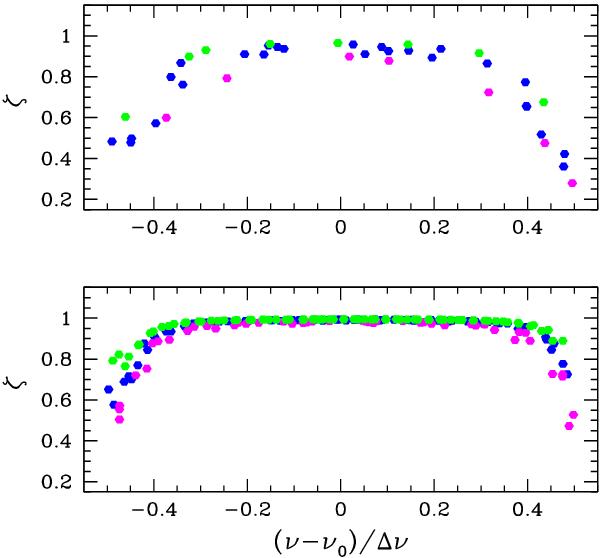
ζ = Icore/I as a function (ν − ν0)/Δν for all l = 1 modes for model M1 (top panel) and for model M2 (bottom panel). ν0 is the frequency of the closest radial mode for the l = 1 mode with frequency ν. For model M1, blue dots correspond to modes with 9 < ν/Δν < 15, magenta dots to modes with ν/Δν > 15, and green dots to modes with ν/Δν < 9). For model M2, blue dots correspond to modes with 8 < ν/Δν < 12, magenta dots to modes with ν/Δν > 12, and green dots to modes with ν/Δν < 8).
Current usage metrics show cumulative count of Article Views (full-text article views including HTML views, PDF and ePub downloads, according to the available data) and Abstracts Views on Vision4Press platform.
Data correspond to usage on the plateform after 2015. The current usage metrics is available 48-96 hours after online publication and is updated daily on week days.
Initial download of the metrics may take a while.