| Issue |
A&A
Volume 549, January 2013
|
|
|---|---|---|
| Article Number | A148 | |
| Number of page(s) | 19 | |
| Section | Extragalactic astronomy | |
| DOI | https://doi.org/10.1051/0004-6361/201220231 | |
| Published online | 16 January 2013 | |
Isolated ellipticals and their globular cluster systems
I. Washington photometry of NGC 3585 and NGC 5812⋆
1 Departamento de Astronomía Universidad de Concepción, Casilla 160 C, Concepción, Chile
e-mail: This email address is being protected from spambots. You need JavaScript enabled to view it.
2 Finnish Centre for Astronomy with ESO, University of Turku, Väisäläntie 20, 21500 Piikkiö, Finland
Received: 14 August 2012
Accepted: 6 December 2012
Abstract
The globular cluster (GC) systems of isolated elliptical galaxies have only recently begun to be studied in detail, and may exhibit morphological connections to the evolutionary histories of their hosts. Here we present the first in a series of wide-field analyses of the GC systems of the isolated ellipticals – Washington C and R photometry of NGC 3585 and NGC 5812 down to R ~ 24 mag. The GC systems are characterised, with each system displaying both the “Universal” blue peak at (C − R) ~ 1.3, and a red peak, but each with differing strengths. The total number of GCs in each system, and their specific frequencies, are estimated. The GC colours and specific frequencies are highly indicative that the host galaxy environment plays a role in shaping its GC system. We produce, and subtract, accurate models of each galaxy, revealing interesting underlying features, including the first definitive evidence that NGC 5812 is interacting with a dwarf companion galaxy. From the galaxy models we also determine surface brightness and colour profiles. Both colour profiles appear quite flat and with (C − R) ~ 1.7 and we discuss the apparent youth of NGC 3585 in the context of this work.
Key words: galaxies: elliptical and lenticular, cD / galaxies: individual: NGC 3585 / galaxies: star clusters: general / galaxies: evolution / galaxies: structure / galaxies: individual: NGC 5812
Figures 6, 7 and Appendix A are available in electronic form at http://www.aanda.org
© ESO, 2013
1. Introduction
There is some strong evidence that giant elliptical galaxies grow their extended stellar haloes slowly, through accretion, around a dense, compact core (e.g. van Dokkum et al. 2010; van Dokkum & Conroy 2012). If this is the case, their halo globular cluster (GC) populations must have been built up in the same manner. Since most elliptical galaxies reside in clusters or groups, where significant quantities of material is available for accretion, the question naturally arises – what about in isolated ellipticals which reside in very low density environments? Interestingly, clues to this may be gleaned from their GC populations.
Recent work by Tal et al. (2012) indicates that many, possibly all, isolated elliptical (IE) galaxies are the result of late mergers and are, therefore, not ancient relics. Currently very little is known about the GC populations of IEs. To date, there are only three giant IEs that have had their GC systems studied in any detail, those of NGC 720 (Kissler-Patig et al. 1996), NGC 821 (Spitler et al. 2008), and NGC 3585 (Hempel et al. 2007; Humphrey 2009). (Cho et al. 2012, also recently added a photometric investigation of NGC 3818 – the only one of the 10 galaxies studied classified as an elliptical and with an environmental density ≲ 0.2 Mpc-3.) None of the galaxies were found to have rich GC systems. From those studies, the estimated total numbers of GCs, and their specific frequencies, for NGC 720, NGC 821, NGC 3585 and NGC 3818, respectively, are GCtot ~ 660 & SN ~ 2.2, GCtot ~ 320 & SN ~ 1.32, GCtot ~ 90 & SN ~ 0.47 and GCtot ~ 240 & SN ~ 1.36.
Here we report on two interesting examples of isolated elliptical galaxies, namely NGC 3585 and NGC 5812. NGC 3585 is classified as E6 by de Vaucouleurs et al. (1991) and a high rotational velocity of at least (157 ± 3 km s-1 – Koprolin & Zeilinger 2000), or even higher (e.g. 206 ± 3 km s-1 – Terlevich & Forbes 2002). Furthermore, it appears to have some asymmetry in its outer isophotes (Tal et al. 2009). Both of these properties are indicative of a recent merger, however, remnants of a merger have yet to be uncovered. In contrast, NGC 5812 appears to be very spherical (classified as E0 by de Vaucouleurs et al. 1991, and has an ellipticity of only 0.05, e.g. Bender et al. 1988). Note that these galaxies are considered isolated in that they have no companion galaxies within 75 kpc, although NGC 5812 may have a small dwarf companion (Madore et al. 2004; Tal et al. 2009, also see Sect. 3.2.1 for a discussion of the companion of NGC 5812). Table 1 summarises the generic properties of each galaxy. The age quoted in Table 1 for NGC 3585 is the time since the most recent star formation event, derived from six colours and four Lick line indices (see Michard 2006, for details). Another age estimate exists in the literature (~3.1 Gyr – Terlevich & Forbes 2002), however, it is unclear how the authors of the study arrived at this value. For NGC 5812 the age is estimated using ⟨ Fe ⟩ and the line strengths of Hβ and Mgb in accordance with single-burst stellar population models (see Trager et al. 2000, for details). The distances quoted in Table 1 are the mean distances from various studies.
Literature galaxy parameters.
Presented here are deep, wide field Washington C and Harris R photometry1 of NGC 3585 and NGC 5812 with the aim of characterising their GC systems, as well as the surface brightness and colour profiles of the galaxies themselves. The Washington photometric system (Canterna 1976) has been chosen as it has the advantage of being a good discriminator between compact blue background galaxies and GC candidates (Dirsch et al. 2003a). Furthermore, an apparently Universal peak exists in the (C − R) colour of old GC populations associated with elliptical galaxies (e.g. Richtler et al. 2012, and references therein), which warrants further investigation.
In the majority of elliptical galaxies, the (C − T1) colour profiles of the GC systems are bimodal, however, the GC systems of truly isolated elliptical galaxies may be unimodal, depending on the assumed formation scenario (e.g. Brodie et al. 2000; Lee et al. 2008). Indeed, in many cases it seems that red (metal rich) GC populations may have formed in situ along with the galaxy, while the bluer (more metal poor) GCs arrived later as part of the hierarchical merger process, assuming mainly minor mergers (Lee et al. 2008; Elmegreen et al. 2012). Moreover, if an early-type galaxy forms from the merger of two gas rich components, an extended burst of GC formation can take place early on. In this case the colour distribution of the GCs is likely to be much broader with less obvious bimodality. Observations of GC systems of elliptical galaxies in Washington filters are, therefore, very useful in tracing of the formation and merger histories of their parent galaxy. In addition, the (C − T1) colour profile of the galaxy itself is strongly indicative of its recent history. For example “wet” (gas rich) major mergers often trigger star bursts (e.g. Eliche-Moral et al. 2010, and references therein), leading to variations in the colour profile.
In Sect. 2 we describe the data aquisition, reduction and photometric calibration. In Sect. 3 the elliptical galaxy models and point source catalogues are presented, as well as a discussion of the apparent dwarf companion of NGC 5812. In Sect. 4 we analyse the galactic surface brightnesses, and in Sect. 5 their colour profiles, based on these models. We present our analyses of the galactic GC populations, based on our photometry, in Sect. 6. Finally, in Sect. 7 we discuss our findings and present our conclusions. Note that the tangential scales used in this paper, at the distances to NGC 3585 and NGC 5812, are ~89 and ~134 parsecs per arcsecond, respectively (see Table 1).
2. Data
2.1. Aquisition and reduction
The data were obtained using the MOSAICII camera on the CTIO 4 m Blanco telescope on Cerro Tololo, Chile, with the Washington C (c6006) and Harris R (c6004) filters, under photometric conditions, on March 19 − 20, 2010. The field of view for the camera is 36′ × 36′, with a pixel scale of 0.27″. For each of the two fields we performed five dithered exposures of 1440 s and one of 300 s in the C filter and five dithered exposures of 720 s plus one of 60 s in the R filter. The mean seeing on the two nights was 1.1″ and 1.3″, respectively. Several Washington standard star fields by Geisler (1990, 1996) were also observed for calibration purposes.
The removal of the instrumental signatures, astrometric alignment, and coaddition of the individual images was carried out using the THELI data reduction pipeline (Erben et al. 2005). Sky subtraction was also performed with THELI; we found that the ideal method came from taking the median value of each chip as the sky value used for subtraction. This also worked for those chips containing the galaxy light because, in general, the galaxy light extended across at least two chips and, therefore, covered much less than half of each chip. Sky subtraction was performed as it is imperative for producing reliable colour maps (Sect. 5).
2.2. Photometry
Due to a lack of airmass variation during our observations it was not possible to determine accurate values for the extinction coefficients for our photometric zeropoint calibration. To determine our photometric zeropoint, therefore, we have taken extinction coefficients, and colour terms, from the literature, both of which show very little variation over time (e.g. see Dirsch et al. 2003a,b; Harris 2007). We have adopted for the C filter a colour term AC(C − R) = 0.1 and extinction coefficient of A(X,C) = 0.3 and for the R filter AR(C − R) = 0.078 and A(X,R) = 0.030.
The photometric zeropoint calibrations were then performed using IRAF routines, as follows. Instrumental magnitudes of the standard stars were calculated using the aperture photometric apphot package, ensuring our aperture sizes matched those used by the Geisler (1990, 1996) studies. Our photometric zeropoint was then calculated for each standard star using:  where Ci and Ri are the instrumental magnitudes, ZPC and ZPR are the zeropoints being calculated, (C − R)std is the (C − R) colour of the standard star from Geisler (1990, 1996), AC(C − R) and AR(C − R) are the colour terms, A(X,R) and A(X,C) are the extinction coefficients and XstdC and XstdR are the airmasses. The mean zeropoint for all ~50 standard stars in the C filter was 0.26 ± 0.09 and for the R filter 0.73 ± 0.07 with the stated uncertainties being the standard deviation of the calculated zeropoints.
The daophot package psf was then used to determine the psf magnitudes of each star in the galaxy-subtracted (Sect. 3) science fields. Finally, before zeropoint correction, we sanity-checked our psf magnitudes by applying apphot to several isolated stars in each field, with aperture radii matching the psf radii used by the psf routine. The mean difference between our psf and aperture photometry for these 15 stars was <0.02 mags in both filters, well within the zeropoint uncertainties.
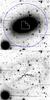 |
Fig. 1 R images of NGC 3585 The upper panel shows the original image while the lower panel shows the image after the galaxy light is removed with ellipse. The images are ~15′ × 15′. North is up and east is to the left. In the upper panel, the approximate size of the WFPC2 footprint (white polygon), and the approximate radius beyond which our point source counts drop to the background level (blue circle), are included for comparison (see Sect. 6). |
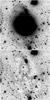 |
Fig. 2 R images of NGC 5812. The upper panel shows the original image while the lower panel shows the image after the galaxy light is removed with ellipse, see text. The images are ~9′ × 9′. North is up and east is to the left. |
3. Galaxy models and point source evaluation
To help facilitate our search for point sources within our fields, and to determine the surface brightness profiles of the galaxies, we subtracted the galaxy light using the IRAF packages ellipse and bmodel. Before producing the ellipse model, it was necessary to replace the central, overexposed, region from each galaxy with the central region from the short exposure in each filter, to ensure the best possible model at all radii. The original R images, with central regions replaced as described, and those with the ellipse model subtracted can be seen in Figs. 1 and 2. A slightly noisy, small, rectangular central region can be seen, particularly in the lower panel of Fig. 2, which is the region that was replaced with that of the short exposure.
3.1. NGC 3585
The ellipse model was applied allowing the centre of the isophotes to shift between successive iterations. Linear steps between iterations were not enforced and we allowed a maximum semi-major axis of 1400 pixels (~380″) to ensure that the model did not extend to unreasonably large radii. In order for the ellipse task to ignore bright sources we set the usclip parameter to 5, enforcing a 5 sigma clipping criterion to deviant points above the mean, which we found to be optimum. To ensure that our sigma clipping method produced reliable ellipse models, we performed two tests. First we used a pixel mask based on the CHECKIMAGE_TYPE variable “segmentation” output of Sextractor and second we employed the ellipse task in interactive mode, which allows for interactive masking during the modelling procedure. The differences between the three models were negligible.
Note that in the lower panel of Fig. 1 some small residual galaxy light remains beyond the edge of the subtracted model. Due to the small fluxes in these regions the modelling did not perform well outside 1400 pixels. Note, however, that the difference between the flux for the regions just inside and just outside the edge of the model are very small ( ≲ 0.01 counts, normalised to a 1 s exposure).
The ellipse task determines the total enclosed flux of the galaxy light within each isophote. Based on the final isophote (with a semi-major axis of 380″), which encloses all the available galaxy light, we calculate the apparent magnitude of NGC 3585 to be mR ~ 8.9. Assuming (V − R) ~ 0.59 ± 0.01 (Table 1) we find a V-band apparent magnitude of mV ~ 9.5 (within the final isophote). We also calculate, from the ellipse model output, an effective radius of Re ~ 80″ with an enclosed surface brightness of R ~ 6.7 mag per square arcsec. We take the effective radius as the radius which encloses half the flux from the galaxy, directly from the ellipse model output tables.
Tal et al. (2009) showed that NGC 3585 has some asymmetry in its outer isophotes and derive an interaction parameter of 0.048, indicating a lack of any clear interaction signature. Our ellipse model shows a small drop in ellipticity from the inner to the outer isophotes (from ~0.42 to ~0.37), although the position angle of the isophotes remains relatively constant at ~285°, whereas the A4 parameter drops from ~0.1 in the inner regions to ~0.001 for the outer isophotes. The A4 parameter is a measure of how “discy” or “boxy” an isophote is (see Bender et al. 1988, for a detailed explanation of the A4 parameter), with positive values indicating discy isophotes and negative values indicating boxy isophotes. We do not see anything unusual in this slight shift to more circular isophotes at large radii, or the drop in the A4 parameter, as both these effects are expected for a galaxy with a discy core.
After subtracting our model, a lot of small-scale structure is revealed. Despite the small interaction parameter assigned by Tal et al. the variety of visible structure leaves little doubt that merger activity has left its imprint. The inner disc is very prominent and there are also apparent faint shells and ripples. Most noteworthy are the two bright residuals emanating from the disc, to the south east and west-south west, which appear to give the impression of a ∩ -shaped structure. However, the apparent symmetry may be a coincidence. We have no reason to doubt the veracity of our galaxy model (see Sect. 3.2), so these visible substructures are indicative of a complex dynamical system.
3.2. NGC 5812
The ellipse model was applied in the same manner as for NGC 3585, however we restricted the maximum semi-major axis to 1000 pixels (~270″), to ensure that the model did not extend to unreasonable radii. Again we set the usclip parameter to 5, which we found to be optimum for removing bright sources from the final model (we performed the same tests as for NGC 3585 to ensure our models were reliable). The ellipse model for NGC 5812 was compared to the calculated isophotal measurements by Bender et al. (1988) and found very good agreement with those authors for all parameters, e.g. position angle, ellipticity, A3 and A4. Bender et al. (1988) did not analyse NGC 3585, however, due to the nearly identical match between our derived parameters and those of that paper for NGC 5812, we see no reason to doubt the veracity of our model for NGC 3585.
From the flux enclosed by the final isophote (with a semi-major axis of ~270″), we find an apparent R magnitude of mR ~ 10.1, derived from the flux internal to the outer isophote from the ellipse task. This relates to an apparent V mag of mV = 10.8, since (V − R) ~0.66 (Table 1). The effective radius, determined in the same way as for NGC 3585, is 35″ with an enclosed surface brightness of ~8.0 mag per square arcsec.
3.2.1. Dwarf galaxy interaction with NGC 5812
It appears that, at least by visual inspection of Fig. 2, that a dwarf companion galaxy is interacting with NGC 5812; apparent tidal debris can be seen to both the north and south of the host galaxy in the upper panel and the bottom panel shows what appear to be tidal arms emanating from the dwarf companion. This dwarf is given the designation of [MFB03] 1 by Madore et al. (2004) who classify it as a nucleated (dNE) dwarf. Furthermore, Tal et al. (2009) assign NGC 5812 with an interaction parameter of 0.08, in between their thresholds of marginally and clearly interacting systems. Although not spectroscopically confirmed, Fig. 3 shows a contour map of the structure which clearly reveals the coherent tidal feature; the tidal nature of the tail is confirmed by the tell-tail “S” shaped signature of tidal debris and the changing position angle (PA) of the luminosity contours with radius (e.g. McConnachie & Irwin 2006, and references therein). It is also clear that the model subtraction reveals a plethora of other faint structures throughout the galaxy, an indication that the dwarf must have completed several orbits of NGC 5812.
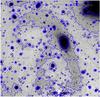 |
Fig. 3 Contour map of the coherent tail structure, in the galaxy subtracted R-band image, emanating from the interacting dwarf galaxy. The lowest contour level (background) is 0.0 increasing in steps of 0.1. The image is |

We wanted to ensure that the observed features were not simply the effects of flat fielding, or the result of other instrumental or data reduction processes. To this end, we downloaded the image of NGC 5812 analysed by Tal et al. (2009)2, produced an ellipse model in the same manner as for our own data, and subtracted this model from the image. All features seen in our model subtracted image in Fig. 2 are also visible in the model subtracted image from the Tal et al. data, including all faint structures internal to the galaxy. Therefore, we consider all the features revealed in our Fig. 2 to be real structures produced by the tidal stripping of the interacting dwarf.
In addition, an attempt was made to derive the integrated R magnitude of the dwarf galaxy. This was done with the IRAF ellipse task, in much the same way as for the ellipticals themselves. The maximum semi-major axis for the model was chosen to be 9.5″ as this was deemed the likely extent of the main body of the dwarf through visual inspection of the R image (see Table A.3 for the output of the ellipse model). From the flux enclosed within the outermost isophote of the model, we calculate the apparent magnitude for the dwarf galaxy to be mR ~ 16.6. Moreover, in addition to the changing PA of the luminosity contours discussed above, the PA of the isophotes in the ellipse model increase steadily with radius from ~−80° near the core to ~−15° in the outer isophotes. This makes it very clear that the dwarf is undergoing a tidal interaction with NGC 5812, and to the best knowledge of the authors, this is the first definitive evidence that [MFB03] 1 is interacting with NGC 5812. See Sects. 7.2 and 7.4 for further discussion.
3.3. Point source colour–magnitude diagrams
To eliminate the majority of spurious point source detections (those which may be background galaxies, CCD imperfections, blooming spikes, etc) we performed cuts based on the χ and sharpness parameters from the psf fitting, restricting our selection to objects with χC < 0.10, χR < 0.15, −0.8 < sharpC < 0.8 and − 0.8 < sharpR < 0.3. These restrictions were chosen because it was at these values that the χ and sharp parameters began to diverge. This left ~ 5900 and ~ 8000 point sources for NGC 3585 and NGC 5812, respectively, with the brightest, non-saturated, objects having R ≳ 17.5. These were extinction corrected, taking E(B − V) ~ 0.064 and ~ 0.087 for NGC 3585 and NGC 5812, respectively (Schlegel et al. 1998). E(B − V) values were then converted to E(C − T1) via the transformation 1.966 × E(B − V) = E(C − T1) (Geisler et al. 1991). Figure 4 shows the colour–magnitude diagrams (CMDs) of all extinction corrected point sources remaining after the cuts from both fields.
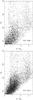 |
Fig. 4 Extinction corrected CMDs of all point sources in the NGC 3585 (top) and NGC 5812 (bottom) fields. Globular cluster candidates are known to have colours in the range 0.9 ≲ (C − R) ≲ 2.3 (e.g. Dirsch et al. 2003b). Objects located at (C − R) ≳ 3 are mostly Galactic foreground stars and objects with R ≳ 23 and (C − R) ≲ 1 are mainly background galaxies. |
In the CMD from the NGC 5812 field (lower panel of Fig. 4) an apparently extra-Galactic overdensity of point sources can be seen at R > 22 and 0.6 ≲ (C − R)0 ≲ 0.9. It is interesting to note that because this field is in approximately the right location of the sky, the feature at R ~ 22 may represent the main sequence turn off (MSTO) of the Sagittarius (Sgr) dwarf galaxy tidal stream. The Sgr dwarf tails have been shown to have a main sequence turn off of VMSTO ~ 21 (e.g. Fahlman et al. 1996; Majewski et al. 1999). Since, in our CMD, these objects are relatively blue, we expect (V − R) > 0 and, therefore, if this sequence was the MSTO of stars in the Sgr dwarf tidal tail we find that VMSTO > 22. This is apparently incompatible with the values quoted from the literature and it must correspond to stars at a greater distance than those in the Sgr tidal tails. We are, therefore, unsure what this feature in the CMD is likely to be and leave it as a topic for a future study, as it is outside the scope of this paper to analyse it in more detail here.
4. Surface brightness profiles
To determine the surface brightnesses of each galaxy we have chosen to fit a double beta-model (e.g. Richtler et al. 2011, and references therein) because it provides an analytic solution for projected luminosity and allows for analytical deprojection and analytically calculable cumulative luminosity. The double beta-model is given by: ![Mathematical equation: \begin{equation} \mu_V(R)=-2.5\times\log\left[a_1\left(1+\left(\frac{R}{r_1}\right)^2\right)^{\alpha_1}+a_2\left(1+\left(\frac{R}{r_2}\right)^2\right)^{\alpha_2}\right]. \end{equation}](/articles/aa/full_html/2013/01/aa20231-12/aa20231-12-eq111.png) (3)
(3)
4.1. NGC 3585
Our best fit double beta-model to the flux of NGC 3585 (from the ellipse model) has a1 = 2.0 × 10⁻⁶, r1 = 1.0″, a2 = 1.5 × 10⁻⁷, r2 = 10.0″ and α1 = α2 = − 1.0. The double-beta surface brightness model and the output of the ellipse task, both in magnitudes per square arcsecond, are shown together in Fig. 5.
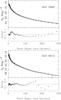 |
Fig. 5 R0 surface brightness profiles of NGC 3585 (top) and NGC 5812 (bottom). Top panels: the circles show the extinction corrected R magnitudes per square arcsec, calculated from the R flux as measured by the ellipse task. The solid curves are the double beta model fits. The residuals to the fits are shown in the bottom panels. Note that in both galaxies the fits are excellent (Δmag < 0.1) at almost all radii. Data points and residuals are only shown for R > 4″ and R > 3″ for NGC 3585 and NGC 5812, respectively, due to the limitations of the ellipse models in the central regions. |
4.2. NGC 5812
Treating NGC 5812 in the same manner as NGC 3585 we find that the best fitting double beta-model has a1 = 2.6 × 10⁻⁷, r1 = 3.9″, a2 = 3.3 × 10⁻⁹, r2 = 55.2″ and α1 = − 1.2 and α2 = − 1.9 (Fig. 5).
Note that our surface brightness models in Fig. 5 are fits to the semi-major axis of the isophotes. Therefore, to test of the veracity of our surface brightness models, we also produced fits to the flux enclosed within circular apertures and integrated these out to various radii to determine the enclosed flux. We then converted these into magnitudes for comparison with Prugniel & Heraudeau (1998). We find that at all available radii, our surface brightness models for both galaxies agree to within 0.2 mag to the values quoted by Prugniel, however, the agreement is almost always better than 0.05 mag. For those radii where our integrated surface brightness model magnitudes differ from those by Prugniel the most, the Prugniel values are apparently spurious (e.g. for NGC 3585, the quoted magnitude for a ~ 13″ radius aperture is brighter than for apertures of larger radii).
5. (C – R) colour maps and colour profiles
Colour maps of elliptical galaxies can show, for example, evidence of dust and star formation, by revealing minute differences in colour in the luminous component of a galaxy (e.g. in NGC 1316 – Richtler et al. 2012). We produced colour maps for both galaxies, with special interest in searching for any interesting colour variations in the central discy feature of NGC 3585.
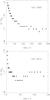 |
Fig. 8 Colour profiles of NGC 3585 (top) and NGC 5812 (bottom). Note the trend to redder colours at small radii in both galaxies. The inner region of NGC 3585 is dominated by discy structure (see Fig. 1) which has a slightly redder colour than the mean. The very inner region of NGC 5812 contains a slightly off-centre, almost spherical, redder region. Note that in both cases the colour of the reddest, inner-most regions is ≲ 0.1 mag redder than the mean colour of the galaxy. |
The colour maps were produced by converting the reduced, combined, extinction corrected images to the magnitude scale with the IRAF routine imarith (i.e. − 2.5 × log [flux] ) for both filters. Note that the THELI pipeline does not estimate sky/background uncertainties so we estimated these uncertainties using Sextractor (Bertin & Arnouts 1996). We used a BACK_SIZE of 64 and BACK_FILTERSIZE of 7 to ensure that all faint objects were extracted. The background estimates were very nearly identical to those given by the THELI pipeline, within ~2 counts, a good indication that our background estimates are reliable. The background uncertainties from Sextractor are ~11.5 and ~15.9 counts, respectively, for the C and R images of NGC 3585, and ~12.1 and ~15.5 counts, respectively, for the C and R images of NGC 5812, which is the 1σ deviation from the mean of all pixels considered background. We then subtracted the R image from the C image to produce a 2D (C − R) colour map (Figs. 6 and 7). The ellipse task was then employed to produce “colour isophotes” (or isochromes) in the same manner as for the galaxy surface brightness models. The isochromes were then converted to colour profiles (Fig. 8).
The most interesting result from the 2D colour maps is that we found almost no evidence for any dust, or star formation, within either galaxy. NGC 3585 shows a small, edge on, slightly redder disc ~45″ across in the centre of the galaxy. This coincides perfectly with the position angle of the discy core discussed in Sect. 3. The most obvious explanation for this reddening is dust, however, the reddening is very slight (~0.1 mag, see Figs. 6 and 8), therefore, if dust is the cause, it must be very diffuse.
NGC 5812, on the other hand, has a small (~15″ diameter) circular reddened region in its core, however, the reddening in this case is much lower (~0.05 mag) so, again, the dust, if this is the cause, must be even more diffuse than that in the core of NGC 3585. The dwarf companion of NGC 5812 has a mean colour of (C − R)0 ~ 1.3, i.e. ~0.4 bluer than NGC 5812, however, there is no obvious blue excess associated with tidal tails of the dwarf in either the colour maps, or in Fig. 8. It is our opinion that this lack of obvious colour excess in the tidal tails is due to our photometry not being deep enough or that the bright body of NGC 5812 simply overwhelms the faint tidal tails to such a degree that the colour of the tails are lost.
Outside the inner regions, the colour profiles of both galaxies are remarkably flat, both having an intrinsic colour of (C − R) ~ 1.7, a colour fairly typical for elliptical galaxies. Interestingly, while the colour of NGC 3585 is fairly typical for elliptical galaxies, it is unclear how the youth of the galaxy and the blue component of the GC population can be reconciled with the galaxy colour.
6. The globular cluster systems
To determine the point source background densities we binned all point sources within each field into annular bins to produce a density profile. The background was then located visually and subtracted. The results are shown in Fig. 9. The surface density of the NGC 3585 field drops to the background (3.9 × 10⁻⁴ point sources per square arcsecond) at Rbg ~ 400″ and for NGC 5812 at Rbg ~ 200″ (4.8 × 10⁻³ point sources per square arcsecond). Furthermore, it is clear that the distributions of GC candidates of both galaxies do not follow a strict power law and are, in fact, best described by a Sérsic profile (Fig. 9).
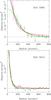 |
Fig. 9 Background subtracted surface density of point sources per square arcsecond within 800″ of NGC 3585 (top) and NGC 5812 (bottom). The density falls to the background level at R ~ 400″ for NGC 3585 and R ~ 200″ for NGC 5812. The black, green and red curves are the best fit exponential, Sérsic and power law functions, respectively. In both cases the Sérsic drop offs describe the density profiles much more closely than either a power law or an exponential. |
To properly characterise the GC candidates it is necessary to produce colour distributions of the point sources within the radii determined above. Histograms of the normalised background sources, sources with R < Rbg and the difference between the two are shown in Fig. 10. Old GC populations appear to have a Universal colour peak at (C − T1) ~ 1.3 (e.g. Dirsch et al. 2003b, 2005; Lee et al. 2008; Park et al. 2010; Schuberth et al. 2010; Richtler et al. 2012). Fig. 10 shows that both NGC 3585 and NGC 5812 also contain populations with this colour peak, strengthening this apparent universality. The strength of the blue peak in NGC 5812, in comparison the weaker blue peak of NGC 3585, may be explained by accretion of old GCs from the interacting dwarf galaxy. The blue GCs are not obviously concentrated near the dwarf, however, this is not surprising because the dwarf has obviously been through several orbits, based on the length of the tidal tails, and the plethora of faint tidal debris throughout the elliptical (Sect. 3.2). It is, therefore, to be expected that these accreted GCs should, at the present time, be fairly evenly distributed throughout the galaxy.
Both GC populations exhibit blue excesses – objects with bluer colours than those of the old GCs ( [C − R] ≲ 0.8). These may be young GCs. In the case of NGC 3585, the ~12 objects with (C − R) ~ 0.5 may be a young population, of unknown origin. In the case of NGC 5812 these objects have a large spread in colour 0 ≲ (C − R) ≲ 0.8, evidence for an extended formation period. We discuss the possibilities for the blue GC populations of both galaxies in Sect. 7. Both galaxies also exhibit some red excess, with objects redder than that of the main red peaks, i.e. (C − R) ≳ 2.4 and (C − R) ≳ 1.9 for NGC 3585 and NGC 5812, respectively. For both galaxies these red objects are scattered fairly evenly throughout the field, so cannot be attributed to a background galaxy cluster. However, for NGC 5812, there are only a few objects, and these may be individual background galaxies. For NGC 3585, the vast majority of the red excess is concentrated in a small colour range, 2.4 ≲ (C − R) ≲ 2.8. The nature of these objects is unknown and, therefore, for the time being, remains a mystery.
It is interesting to note that the ratios of the full width half maxima (FWHM) of the Gaussian fits to the GC candidate blue and red peaks in each of the fields is nearly identical at ~2.0 despite the other parameters differing significantly. This is not a Universal property of elliptical galaxy GC populations, and this ratio may be useful in determining their evolutionary histories. As the GC populations of more elliptical galaxies are studied it should become clear what can be gleaned about their evolutionary histories from this information.
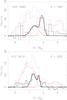 |
Fig. 10 Area normalised, extinction corrected histograms of point sources from the NGC 3585 (top) and NGC 5812 (bottom) fields. The blue dotted histograms are all sources with radii <400″ for NGC 3585 and radii <200″ for NGC 5812, i.e. all sources at radii with point source counts higher than the background (see Fig. 9). The red dashed histograms show normalised counts for all sources with radii >540″ for NGC 3585 and radii >400″ for NGC 5812, ensuring that point source counts have dropped to the background level. The solid black histogram shows the inner counts minus the background. Double Gaussian fits to the two main peaks are shown as solid black curves, and the red dotted curves are the individual Gaussian components. The double Gaussian peaks are at (C − R) ~ 1.37 (σ ~ 0.28) and (C − R) ~ 1.91 (σ ~ 0.14) for NGC 3585 and (C − R) ~ 1.30 (σ ~ 0.18) and (C − R) ~ 1.68 (σ ~ 0.07) for NGC 5812. Bin widths are 0.17 mag for NGC 3585 and 0.11 mag for NGC 5812. |
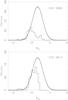 |
Fig. 11 Histograms of the background subtracted luminosity functions of the GC candidates of NGC 3585 (top) and NGC 5812 (bottom) in absolute R magnitudes. The solid curves are Gaussian fits to the data, restricting the mean to MR = − 8.0 and the width to σ = 1.4, and fitting only to complete magnitudes, as described in the text. Bin widths in both cases are 0.44 mag. |
6.1. NGC 3585
In total ~130 GC candidates have been identified in the NGC 3585 field. The luminosity function (GCLF) of the GC candidates is shown in Fig. 11. The GCLF was derived by binning the R magnitudes of point sources with 0.6 ≲ (C − R) ≲ 2.4, of both background sources (those at radii larger than 540″), and sources at radii less than 400″ and subtracting one from the other, in a similar manner as the colour profile. A Gaussian fit was produced by fixing the R turnover magnitude at MR,TO = − 8.0 (assuming MV,TO ~ −7.4 [Rejkuba 2012] and [V − R] ~ 0.6 [Table 1]). Because we have not performed a completeness test on our point source data, we fixed the width of the Gaussian fit to be σ = 1.4 (Rejkuba 2012, and references therein) to ensure that the uncertainty in the total number of GCs was minimised as much as possible. The amplitude was left as the only free parameter. The best fit has an amplitude of ~ 69.6. Integrating this Gaussian gives the estimated total number of GCs expected in the system to be ~550. Note that this Gaussian was only fit to objects brighter than R = 21 where our data is close to complete. It should be noted here that we did not perform any completeness testing because the only result relying on the completeness of the data is the total number of GCs based on the GCLF. We note that this lack of a completeness test will affect the uncertainty of the calculated number of GCs and that this is, therefore, only and indication of the true number. We note also, however, that from previous experience (e.g. Conn et al. 2007, 2008, 2012) we can be fairly certain that the completeness is close to 100% at the limiting magnitude we have chosen (R = 21).
Assuming the specific frequency relation given by Harris (1991) and an absolute magnitude of MV = − 21.8 from Sect. 3 gives a specific frequency of SN ~ 1.05. This is, it must be stressed, only an indication of the true specific frequency since our total number of GCs is only an estimate. However, this is fairly typical, albeit at the low end, for specific frequencies of elliptical galaxies in low density environments (e.g. Harris 1991). It should be noted that the variation in distance estimates quoted by NED (see Table 1) will affect specific frequency estimate. Using the lower and upper limits for the distance quoted by NED gives absolute magnitudes of MV = − 21.1 and MV = − 22.4, respectively. This leads to specific frequencies of SN ~ 2.0 and SN ~ 0.6, however, we remind the reader that our estimates are only an indication of the true specific frequency due to the uncertainties in our estimates for the total number GCs, as well as the distance uncertainties in the literature. It should also be noted that this range of specific frequencies is still within the accepted range for IEs (e.g. Harris 1991). Furthermore, the most recent distance estimates mostly cluster around our adopted distance of ~ 18.3 Mpc. This indicates that the large discrepancy in distances quoted by NED is probably misleading, and that both our adopted distance for this galaxy, and hence the specific frequency, are more reliable that it may appear.
Humphrey (2009), using Wide Field Planetary Camera 2 on the Hubble Space Telescope (HST), observed 102 GCs candidates associated with NGC 3585 and found MV,TO ~ −6.75 and SN ~ 0.47. This ~1 mag difference between the turnover measured by Humphrey (2009) and that quoted for old GCs by Rejkuba (2012), and the ~0.5 discrepancy between the specific frequency quoted by Humphrey (2009) and our measurement, can possibly be attributed to the small radii analysed by Humphrey (2009) and, of course, to the uncertainty in our estimate of SN. The largest radii measured by Humphrey (2009) is  , which is < 20% of the radius at which we find GC candidates. Moreover, when including all ~1000 GCs in their sample (from 19 early-type galaxies) Humphrey (2009) find MV,TO ~ −8 (note that the distance adopted by Humphrey is 18.6 ± ~ 2 Mpc and ours is 18.3 Mpc, so our adopted distance is well within the uncertainties of the Humphrey value, therefore, MV,TO ~ −8 is a reasonable assumption). However, it is very possible that the GC population of NGC 3585 is young, which would account for the dimmer peak in the GCLF (see Sect. 7). A young GC population does not, however, account for the low SN value stated by Humphrey (2009). Whatever the cause of the discrepancy between our SN and that quoted by Humphrey (2009), the peak absolute magnitude of our GCLF does not affect the shape of our Gaussian fit to the GCLF nor, therefore, our SN or estimated total number of GCs.
Two studies list catalogues of GC candidates for the NGC 3585 system, namely Hempel et al. (2007), with 26 candidates using the FORS2 instrument on the Very Large Telescope, and Humphrey (2009) with 102 using HST data from the WFPC2 instrument. Cross matching our GC candidates with those catalogues finds only two matches. This paucity in common GC candidates is due those studies being restricted to the inner  (see Fig. 1 for the approximate size of the footprint of WFPC2, as well as the approximate radius beyond which our point source counts drop to the background level, overlaid onto our R image) as well as to faint objects. The two GC candidates in common with those studies are shown in Table 2 which lists positions and magnitudes in available filters from the literature and the current work.
Globular cluster candidates of NGC 3585 in common with literature values.
Parameters for each galaxy derived in the current paper.
6.2. NGC 5812
In total ~180 GC candidates have been identified in the NGC 5812 field. As with NGC 3585, the luminosity function of the GC candidates is shown in Fig. 11. The luminosity function was derived in the same manner as NGC 3585, however, the colour range was chosen to be 0.8 ≲ (C − R) ≲ 2.0, the inner radius to be 200″ and the radius at which point sources drop to the background level was 400″. Again the turnover magnitude for the Gaussian fit was chosen to be MR = −8.0 and the width was chosen to be σ = 1.4, with the amplitude left free. The best fit has an amplitude of ~50.8. Integrating this Gaussian in the same manner as for NGC 3585 gives the estimated total number of GCs expected in the system as ~400. Note that this Gaussian was only fit to objects brighter than R = 21 to ensure we were fitting to complete data.
Again, assuming the specific frequency relation by Harris (1991), we find a specific frequency of ~1.2. This is, as with NGC 3585, only an indication of the true specific frequency, however, it is fairly typical for specific frequencies of elliptical galaxies in low density environments (e.g. Harris 1991). As for NGC 3585, if we assume the extremes of distance estimates from NED, we find absolute magnitudes of MV ~ −21.0 and MV ~ −21.7 giving SN ~ 1.6 and SN ~ 0.8, respectively. Again, as with NGC 3585, these values are well within the accepted range for IEs, with the uncertainties arising from the uncertainties in both literature distances and our estimate of the total number of GCs. Note also that, as with NGC 3585, the more recent distance estimates all cluster around the mean value we have adopted (~27.7 Mpc) indicating that both our adopted distance for this galaxy, and hence the specific frequency, are more reliable that it may appear at first glance.
7. Discussion and conclusions
Using wide-field Washington C and R photometry, reaching to a point source magnitude of R ~ 24, we have produced accurate galaxy models for NGC 3585 and NGC 5812, using the IRAF ellipse task. In this section we discuss the analysis of these models, and the underlying structures revealed through their subtraction. Note that all parameters derived in the current work are presented in Table 3 for clarity.
7.1. Galaxy morphologies
We find that the outer isophotes of NGC 3585 become slightly less elliptical at large radii, which is expected for a galaxy with a discy core. After subtracting the galaxy model, an unexplained ∩ -shaped feature surrounding the centre of NGC 3585 is revealed. This feature has the same colour (to within 0.01 mag) as the surrounding galaxy light, and we do not know the nature of this feature. It is beyond the scope of this paper to investigate this further, however, we are under the working assumption that is a real feature since we have no reason to doubt the veracity of our galaxy model. After subtracting the models, many other structures are also revealed in both the NGC 3585 and NGC 5812 systems, indicative of complex dynamical systems.
The surface brightness profiles for each galaxy were fitted with double beta-models, the integration of which result in magnitudes that agree very well with literature values. Two dimensional colour maps, and profiles, were produced and show a distinct lack of any star formation, or dust (except in the very centres of the galaxies), which seems to indicate no recent major merger activity. In addition, the very slight blue colour trend for the minor axis and red, ~40″ diameter, disc in the core of NGC 3585, originally shown by Fisher et al. (1996), are both confirmed. Our colour profiles, and 2D colour maps, reveal a red discy region with a semi-major axis of ~45″, probably associated with diffuse dust, in the core of NGC 3585. A fairly spherical region of very diffuse dust also surrounds the core of NGC 5812, out to a radius of ~7−8″. Outside the diffuse dust in the central regions, the colour profile of each galaxy is very flat, and is fairly typical of field ellipticals at (C − R) ~ 1.7.
7.2. Dwarf galaxy interaction with NGC 5812
The interaction between NGC 5812 and its dwarf companion galaxy, [MFB03] 1, has been confirmed here for the first time. The coherent nature of the debris resulting from the interaction, as well the change in position angle of the isophotes with radius, and the tell-tail “S” shape of the isophotal contours of the region immediately surrounding the dwarf, confirm the tidal nature of this debris (McConnachie & Irwin 2006, and references therein). We have calculated the apparent magnitude of the dwarf to be mR ~ 16.6.
While it is clear that the dwarf companion is interacting with NGC 5812, and that the companion is bluer than the host galaxy by (C − R) ~ 0.4 mag, no indication of the tidal tails can be seen in the colour map. We attribute this lack of blue excess in the colour map to our photometry being too shallow for the colour of the low density tidal tails to be measured, or that it is simply overwhelmed by the much more luminous body of NGC 5812.
7.3. Galaxy and globular cluster age of NGC 3585
The age quoted in Table 1 for NGC 3585 is apparently very young (~1.72 Gyr – Michard 2006). We felt it was important to discuss this, because it seems inconsistent with the colour we have calculated for this galaxy, there are no obvious merger remnants and there is no obvious colour gradient, in contrast to what is expected of young galaxies. To address this we now look at several issues, namely the GCLF and D-σ (Dressler et al. 1987) distances, the GCLF turnover magnitude and the blue objects (C − R) ~ 0.5 shown in Fig. 10.
Firstly, to verify our colour of (C − R) ~ 1.7 is correct, we compared this with the theoretical conversion to (B − I) by Richtler et al. (2012). We find that the (B − I) colour given by Prugniel & Heraudeau (1998) is in good agreement with our (C − R) colour.
The only measured GCLF distance to NGC 3585 is that by Humphrey (2009) of ~24 Mpc (MV,TO ~ −6.75), which is in stark contrast to the Dn-σ distance estimates by Willick et al. (1997) of ~12.9−15 Mpc. The magnitude of the GCLF turnover by Humphrey (2009), in comparison to the 1 mag brighter “Universal” MV,TO ~ −7.4 for old GCs (Rejkuba 2012), indicates that this GC population contains a young component, because young populations introduce a bias towards fainter turnover magnitudes. Furthermore, the large difference between the GCLF and Dn-σ distances is also indicative of a young component in the GC population, as well as a younger stellar population of the galaxy itself. This is because a fainter GCLF turnover magnitude implies greater distance, whereas a younger, and, therefore, brighter galactic stellar population will bias the distance measurement to smaller Dn-σ distances. Therefore, a deviation between the Dn-σ and GCLF distance estimates points to a young galaxy (see Richtler 2003, for a detailed discussion). We conclude, therefore, that both NGC 3585 itself and its GC population must contain youthful components. Furthermore, in the case of the GC population, we point to the blue, (C − R) ~0.5, peak in the GC distribution (Fig. 10) as being this young population.
It is interesting that the (C − R) colour of the galaxy light does not indicate a young galactic stellar population. Nor is there any colour gradient in the galactic stellar body, or any obvious tidal debris associated with this galaxy, which would confirm its youthfulness. We cannot conclude, therefore, anything with regard to the young age of the galactic population itself, except to state that its apparent immaturity remains a mystery, at least for the time being.
7.4. Globular cluster systems
The GC systems of each galaxy have been characterised here for the first time in the Washington photometric system, with ~130 and ~180 GC candidates being uncovered for NGC 3585 and NGC 5812, respectively. We find that the radial density profile of both GC systems closely match a Sérsic distribution. Assuming the GCLFs follow simple Gaussian distributions, we calculate that NGC 3585 has ~ 550 associated GCs, and for NGC 5812 about 400. The specific frequencies for the two galaxies are calculated to be SN ~ 1.05 and SN ~ 1.2 for NGC 3585 and NGC 5812, respectively. Both galaxies, therefore, have quite poor GC systems, however, this is typical for field ellipticals. The total number of GC candidates detected in the current study for NGC 3585 increases the number of known GC candidates in this galaxy by ~ 40 from the Humphrey (2009) study, and our estimate of the specific frequency is more than double that of Humphrey. We attribute these increases to the wide-field nature of our survey, however, even with these updated values of the total number of GCs and the specific frequency, NGC 3585 still has a poor GC system, which is expected for an IE. Both GC systems exhibit the apparently Universal blue peak at (C − R) ~ 1.3 (σ3585 ~ 0.28 and σ5812 ~ 0.18), and both systems exhibit clear colour bimodality, with the red peaks at (C − R)3585 ~ 1.91 (σ ~ 0.14) and (C − R)5812 ~ 1.68 (σ ~ 0.07).
There appears to be a Universal blue peak in old GC populations of early-type galaxies ( [C − T1] ~ 1.3: e.g. Dirsch et al. 2003b, 2005; Lee et al. 2008; Park et al. 2010; Schuberth et al. 2010; Richtler et al. 2012, and the current paper) which likely indicates that the merger histories of ellipticals are essentially “dry” (gas poor) and dominated by old stellar populations (see also Tal et al. 2009, for further discussion). Interestingly, there are hints that this Universal colour peak also extends to nearby spiral galaxies (e.g. Kim et al. 2007, who find that the peak colour of the blue GC population of M31 is at [C − T1] ~ 1.4), however, this does not seem to be true for the Milky Way (Smith & Strader 2007).
The lack of obvious star formation due to the dwarf interacting with NGC 5812 seems to imply that this particular interaction is also fairly dry, at least at the present time. However, there is clearly an excess of objects bluer than the blue peak at 0 ≲ (C − R) ≲ 0.9. It seems that these objects can come from two sources. Firstly, accretion of young clusters from the interacting dwarf. We do not consider this the most likely scenario because there is no reason for the dwarf to contain GCs which are younger, i.e. bluer, than the dwarf itself ( [C − R] dwarf ~ 1.3). Secondly, Proctor et al. (2005) showed that a star burst with ~ 0.2% of the larger galaxy mass can be triggered solely by the tidal forces exerted by a low mass encounter. If we assume that all the GCs have been produced by the interaction and are now evenly distributed about the host (Sect. 6), we can estimate the number of GCs that have been formed. If we take the maximum/minimum distances given by NED, mR = 16.6 (Sect. 3.2.1) and (V − R) = 0.66 (Table 1), the dwarf companion has 14.5 ≲ MV ≲ 15.2. The specific frequency of dwarf spheroidal galaxies with the absolute magnitude range of the dwarf companion of NGC 5812 is 2 ≲ SN ≲ 30 (e.g. van den Bergh 1998; Elmegreen 1999; Miller & Lotz 2007). The total number of GCs in the system may be, therefore, as few as ~ 2 or as many as ~ 40. This means that the blue excess of objects in the NGC 5812 field can be completely attributed to young, blue, GCs formed in the interaction, since there are 42 objects in the field with (C − R) < 0.9. It is this scenario which we find much more satisfactory; the blue GCs formed, and may still be forming, due to dynamical processes from the interaction. The most likely process being tidal influences, because of the apparent dryness of the merger. Not only does this scenario explain the excess of blue objects associated with NGC 5812, but explains the high specific frequency of the companion ( ≳ 30). Moreover, it is apparent from Fig. 10 that the blue GC candidates in question are evenly distributed in colour. This colour distibution is expected if these GCs have been formed at a constant rate (assuming similar cluster masses, metallicities, etc.), which seems likely if they have been produced by the interaction between NGC 5812 and its dwarf companion. In addition, the blue GC candidates are evenly distibuted about NGC 5812, with no obvious concentrations near the dwarf companion, or other tidal features. This should be expected because it is clear that the dwarf has been interacting with NGC 5812 for several orbits, based on the length of the tidal tails and the abudance of other tidal debris surrounding NGC 5812.
There appear to be a few ( ≲ 5) GC candidates associated with each galaxy that are very bright, with MR ~ − 13 (see Fig. 11). These clusters must be massive, however, no HST data appears to exist for these objects (Sect. 6.1). This indicates that they were not formed in a recent starburst, which would be expected near the centre of the galaxy, but have been accreted.
Lastly, it is quite clear that the suppressed blue peak of the old GC population of NGC 3585 is a product of its isolated environment. The isolation of this galaxy can also be gleaned from its very low SN. Because the old GCs do not dominate the GC population, as they do in NGC 5812, this is highly indicative that the host galaxy environment plays a role in shaping its GC system.
Online material
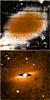 |
Fig. 6 (C − R) colour maps of NGC 3585. The top panel shows the entire galaxy and has the same dimensions as Fig. 1 (~15′ × 15′). The colour range shown is 1.1 ≲ (C − R) ≲ 2.5, with bluer colours darker, and redder colours lighter. It is clear that no strong colour gradient is present out to large radii. The lower panel shows the inner ~75″ × 75″ over a colour range of 1.73 ≲ (C − R) ≲ 1.85. The ~ 45″ discy structure discussed in the text is clearly visible. The noisy rectangular region surrounding the galaxy core is the short exposure that was used to replaced the overexposed central region (see Sect. 3) and does not affect the colour profile in any way. |
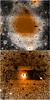 |
Fig. 7 (C − R) colour maps of NGC 5812. The top panel shows the entire galaxy and has the same dimensions as Fig. 2 (~9′ × 9′). The colour range shown is 1.1 ≲ (C − R) ≲ 2.5, with bluer colours darker, and redder colours lighter. It is clear that no strong colour gradient is present out to large radii. The lower panel shows the inner ~75″ × 75″ over a colour range of 1.71 ≲ (C − R) ≲ 1.80. The circular, redder region, ~15″ in diameter, as discussed in the text, is clearly visible. The noisy rectangular region surrounding the galaxy core is the short exposure that was used to replaced the overexposed central region (see Sect. 3) and does not affect the colour profile in any way. |
Appendix A: IRAF ellipse model tables
ellipse model of NGC 3585.
Note that the spectral response of the Harris R and Washington T1 filters are effectively equivalent for objects with (C − T1) ≲ 3.5, however the R filter is preferable due to its higher throughput (Geisler 1996).
Acknowledgments
R.R.L. acknowledges financial support from FONDECYT, project No. 3130403. T.R. acknowledges financial support from the Chilean Center for Astrophysics, FONDAP No. 15010003, from FONDECYT project No. 1100620, and from the BASAL Centro de Astrofisica y Tecnologias Afines (CATA) PFB-06/2007. R.S. thanks Paula Zelaya for interesting discussions. The authors gratefully thank the anonymous referee for many helpful comments which resulted in a much improved manuscript.
References
- Bender, R., Doebereiner, S., & Moellenhoff, C. 1988, A&AS, 74, 385 [NASA ADS] [Google Scholar]
- Bertin, E., & Arnouts, S. 1996, A&AS, 117, 393 [NASA ADS] [CrossRef] [EDP Sciences] [Google Scholar]
- Brodie, J. P., Larsen, S. S., & Kissler-Patig, M. 2000, ApJ, 543, L19 [NASA ADS] [CrossRef] [Google Scholar]
- Canterna, R. 1976, AJ, 81, 228 [NASA ADS] [CrossRef] [Google Scholar]
- Cho, J., Sharples, R. M., Blakeslee, J. P., et al. 2012, MNRAS, 422, 3591 [NASA ADS] [CrossRef] [Google Scholar]
- Conn, B. C., Lane, R. R., Lewis, G. F., et al. 2007, MNRAS, 376, 939 [NASA ADS] [CrossRef] [Google Scholar]
- Conn, B. C., Lane, R. R., Lewis, G. F., et al. 2008, MNRAS, 390, 1388 [NASA ADS] [Google Scholar]
- Conn, B. C., Noël, N. E. D., Rix, H.-W., et al. 2012, ApJ, 754, 101 [NASA ADS] [CrossRef] [Google Scholar]
- de Vaucouleurs, G., de Vaucouleurs, A., Corwin, H. G., Jr., et al. 1991, Third Reference Catalogue of Bright Galaxies, Version 3.9 (New York: Springer) [Google Scholar]
- Dirsch, B., Richtler, T., Geisler, D., et al. 2003a, AJ, 125, 1908 [NASA ADS] [CrossRef] [Google Scholar]
- Dirsch, B., Richtler, T., & Bassino, L. P. 2003b, A&A, 408, 929 [NASA ADS] [CrossRef] [EDP Sciences] [Google Scholar]
- Dirsch, B., Schuberth, Y., & Richtler, T. 2005, A&A, 433, 43 [NASA ADS] [CrossRef] [EDP Sciences] [Google Scholar]
- Dressler, A., Lynden-Bell, D., Burstein, D., et al. 1987, ApJ, 313, 42 [NASA ADS] [CrossRef] [Google Scholar]
- Eliche-Moral, M. C., Prieto, M., Gallego, J., & Zamorano, J. 2010 [arXiv:1003.0686] [Google Scholar]
- Elmegreen, B. G. 1999, Ap&SS, 269, 469 [NASA ADS] [CrossRef] [Google Scholar]
- Elmegreen, B. G., Malhotra, S., & Rhoads, J. 2012, ApJ, 757, 9 [NASA ADS] [CrossRef] [Google Scholar]
- Erben, T., Schirmer, M., Dietrich, J. P., et al. 2005, Astron. Nachr., 326, 432 [NASA ADS] [CrossRef] [Google Scholar]
- Fahlman, G. G., Mandushev, G., Richer, H. B., Thompson, I. B., & Sivaramakrishnan, A. 1996, ApJ, 459, L65 [Google Scholar]
- Ferrari, F., Pastoriza, M. G., Macchetto, F., & Caon, N. 1999, A&AS, 136, 269 [NASA ADS] [CrossRef] [EDP Sciences] [Google Scholar]
- Fisher, D., Franx, M., & Illingworth, G. 1996, ApJ, 459, 110 [NASA ADS] [CrossRef] [Google Scholar]
- Geisler, D. 1990, PASP, 102, 344 [NASA ADS] [CrossRef] [Google Scholar]
- Geisler, D. 1996, AJ, 111, 480 [NASA ADS] [CrossRef] [Google Scholar]
- Geisler, D., & Lee, M. G. 1999, Proc. IAU Symp., 186, 197 [NASA ADS] [Google Scholar]
- Geisler, D., Claria, J. J., & Minniti, D. 1991, AJ, 102, 1836 [NASA ADS] [CrossRef] [Google Scholar]
- Harris, W. E. 1991, ARA&A, 29, 543 [NASA ADS] [CrossRef] [Google Scholar]
- Harris, J. 2007, ApJ, 658, 345 [NASA ADS] [CrossRef] [Google Scholar]
- Hempel, M., Zepf, S., Kundu, A., Geisler, D., & Maccarone, T. J. 2007, ApJ, 661, 768 [NASA ADS] [CrossRef] [Google Scholar]
- Humphrey, P. J. 2009, ApJ, 690, 512 [NASA ADS] [CrossRef] [Google Scholar]
- Kim, S. C., Lee, M. G., Geisler, D., et al. 2007, AJ, 134, 706 [NASA ADS] [CrossRef] [Google Scholar]
- Kissler-Patig, M., Richtler, T., & Hilker, M. 1996, A&A, 308, 704 [NASA ADS] [Google Scholar]
- Koprolin, W., & Zeilinger, W. W. 2000, A&AS, 145, 71 [NASA ADS] [CrossRef] [EDP Sciences] [Google Scholar]
- Lauberts, A., & Valentijn, E. A. 1989, Garching: European Southern Observatory [Google Scholar]
- Lee, M. G., Park, H. S., Kim, E., et al. 2008, ApJ, 682, 135 [NASA ADS] [CrossRef] [Google Scholar]
- Majewski, S. R., Siegel, M. H., Kunkel, W. E., et al. 1999, AJ, 118, 1709 [NASA ADS] [CrossRef] [Google Scholar]
- Madore, B. F., Freedman, W. L., & Bothun, G. D. 2004, ApJ, 607, 810 [NASA ADS] [CrossRef] [Google Scholar]
- McConnachie, A. W., & Irwin, M. J. 2006, MNRAS, 365, 1263 [NASA ADS] [CrossRef] [Google Scholar]
- Michard, R. 2006, A&A, 449, 519 [NASA ADS] [CrossRef] [EDP Sciences] [Google Scholar]
- Miller, B. W., & Lotz, J. M. 2007, ApJ, 670, 1074 [NASA ADS] [CrossRef] [Google Scholar]
- Park, H. S., Lee, M. G., Hwang, H. S., et al. 2010, ApJ, 709, 377 [NASA ADS] [CrossRef] [Google Scholar]
- Proctor, R. N., Forbes, D. A., Forestell, A., & Gebhardt, K. 2005, MNRAS, 362, 857 [NASA ADS] [CrossRef] [Google Scholar]
- Prugniel, P., & Heraudeau, P. 1998, A&AS, 128, 299 [NASA ADS] [CrossRef] [EDP Sciences] [Google Scholar]
- Rejkuba, M. 2012, Ap&SS, 25 [Google Scholar]
- Richtler, T. 2003, Stellar Candles for the Extragalactic Distance Scale, 635, 281 [Google Scholar]
- Richtler, T., Salinas, R., Misgeld, I., et al. 2011, A&A, 531, A119 [NASA ADS] [CrossRef] [EDP Sciences] [Google Scholar]
- Richtler, T., Bassino, L. P., Dirsch, B., & Kumar, B. 2012, A&A, 543, A131 [NASA ADS] [CrossRef] [EDP Sciences] [Google Scholar]
- Schlafly, E. F., & Finkbeiner, D. P. 2011, ApJ, 737, 103 [NASA ADS] [CrossRef] [Google Scholar]
- Schlegel, D. J., Finkbeiner, D. P., & Davis, M. 1998, ApJ, 500, 525 [NASA ADS] [CrossRef] [Google Scholar]
- Schuberth, Y., Richtler, T., Hilker, M., et al. 2010, A&A, 513, A52 [NASA ADS] [CrossRef] [EDP Sciences] [Google Scholar]
- Smith, G. H., & Strader, J. 2007, Astron. Nachr., 328, 107 [NASA ADS] [CrossRef] [Google Scholar]
- Spitler, L. R., Forbes, D. A., Strader, J., Brodie, J. P., & Gallagher, J. S. 2008, MNRAS, 385, 361 [NASA ADS] [CrossRef] [Google Scholar]
- Tal, T., van Dokkum, P. G., Nelan, J., & Bezanson, R. 2009, AJ, 138, 1417 [NASA ADS] [CrossRef] [Google Scholar]
- Tal, T., Wake, D. A., van Dokkum, P. G., et al. 2012, ApJ, 746, 138 [NASA ADS] [CrossRef] [Google Scholar]
- Terlevich, A. I., & Forbes, D. A. 2002, MNRAS, 330, 547 [NASA ADS] [CrossRef] [Google Scholar]
- Trager, S. C., Faber, S. M., Worthey, G., & González, J. J. 2000, AJ, 119, 1645 [NASA ADS] [CrossRef] [Google Scholar]
- van den Bergh, S. 1998, ApJ, 505, L127 [NASA ADS] [CrossRef] [Google Scholar]
- van Dokkum, P., & Conroy, C. 2012, ApJ, 760, 70 [NASA ADS] [CrossRef] [Google Scholar]
- van Dokkum, P. G., Whitaker, K. E., Brammer, G., et al. 2010, ApJ, 709, 1018 [NASA ADS] [CrossRef] [Google Scholar]
- Willick, J. A., Courteau, S., Faber, S. M., et al. 1997, ApJS, 109, 333 [NASA ADS] [CrossRef] [Google Scholar]
All Tables
All Figures
|
Fig. 1 R images of NGC 3585 The upper panel shows the original image while the lower panel shows the image after the galaxy light is removed with ellipse. The images are ~15′ × 15′. North is up and east is to the left. In the upper panel, the approximate size of the WFPC2 footprint (white polygon), and the approximate radius beyond which our point source counts drop to the background level (blue circle), are included for comparison (see Sect. 6). |
| In the text | |
|
Fig. 2 R images of NGC 5812. The upper panel shows the original image while the lower panel shows the image after the galaxy light is removed with ellipse, see text. The images are ~9′ × 9′. North is up and east is to the left. |
| In the text | |
|
Fig. 3 Contour map of the coherent tail structure, in the galaxy subtracted R-band image, emanating from the interacting dwarf galaxy. The lowest contour level (background) is 0.0 increasing in steps of 0.1. The image is |
| In the text | |
|
Fig. 4 Extinction corrected CMDs of all point sources in the NGC 3585 (top) and NGC 5812 (bottom) fields. Globular cluster candidates are known to have colours in the range 0.9 ≲ (C − R) ≲ 2.3 (e.g. Dirsch et al. 2003b). Objects located at (C − R) ≳ 3 are mostly Galactic foreground stars and objects with R ≳ 23 and (C − R) ≲ 1 are mainly background galaxies. |
| In the text | |
|
Fig. 5 R0 surface brightness profiles of NGC 3585 (top) and NGC 5812 (bottom). Top panels: the circles show the extinction corrected R magnitudes per square arcsec, calculated from the R flux as measured by the ellipse task. The solid curves are the double beta model fits. The residuals to the fits are shown in the bottom panels. Note that in both galaxies the fits are excellent (Δmag < 0.1) at almost all radii. Data points and residuals are only shown for R > 4″ and R > 3″ for NGC 3585 and NGC 5812, respectively, due to the limitations of the ellipse models in the central regions. |
| In the text | |
|
Fig. 8 Colour profiles of NGC 3585 (top) and NGC 5812 (bottom). Note the trend to redder colours at small radii in both galaxies. The inner region of NGC 3585 is dominated by discy structure (see Fig. 1) which has a slightly redder colour than the mean. The very inner region of NGC 5812 contains a slightly off-centre, almost spherical, redder region. Note that in both cases the colour of the reddest, inner-most regions is ≲ 0.1 mag redder than the mean colour of the galaxy. |
| In the text | |
|
Fig. 9 Background subtracted surface density of point sources per square arcsecond within 800″ of NGC 3585 (top) and NGC 5812 (bottom). The density falls to the background level at R ~ 400″ for NGC 3585 and R ~ 200″ for NGC 5812. The black, green and red curves are the best fit exponential, Sérsic and power law functions, respectively. In both cases the Sérsic drop offs describe the density profiles much more closely than either a power law or an exponential. |
| In the text | |
|
Fig. 10 Area normalised, extinction corrected histograms of point sources from the NGC 3585 (top) and NGC 5812 (bottom) fields. The blue dotted histograms are all sources with radii <400″ for NGC 3585 and radii <200″ for NGC 5812, i.e. all sources at radii with point source counts higher than the background (see Fig. 9). The red dashed histograms show normalised counts for all sources with radii >540″ for NGC 3585 and radii >400″ for NGC 5812, ensuring that point source counts have dropped to the background level. The solid black histogram shows the inner counts minus the background. Double Gaussian fits to the two main peaks are shown as solid black curves, and the red dotted curves are the individual Gaussian components. The double Gaussian peaks are at (C − R) ~ 1.37 (σ ~ 0.28) and (C − R) ~ 1.91 (σ ~ 0.14) for NGC 3585 and (C − R) ~ 1.30 (σ ~ 0.18) and (C − R) ~ 1.68 (σ ~ 0.07) for NGC 5812. Bin widths are 0.17 mag for NGC 3585 and 0.11 mag for NGC 5812. |
| In the text | |
|
Fig. 11 Histograms of the background subtracted luminosity functions of the GC candidates of NGC 3585 (top) and NGC 5812 (bottom) in absolute R magnitudes. The solid curves are Gaussian fits to the data, restricting the mean to MR = − 8.0 and the width to σ = 1.4, and fitting only to complete magnitudes, as described in the text. Bin widths in both cases are 0.44 mag. |
| In the text | |
|
Fig. 6 (C − R) colour maps of NGC 3585. The top panel shows the entire galaxy and has the same dimensions as Fig. 1 (~15′ × 15′). The colour range shown is 1.1 ≲ (C − R) ≲ 2.5, with bluer colours darker, and redder colours lighter. It is clear that no strong colour gradient is present out to large radii. The lower panel shows the inner ~75″ × 75″ over a colour range of 1.73 ≲ (C − R) ≲ 1.85. The ~ 45″ discy structure discussed in the text is clearly visible. The noisy rectangular region surrounding the galaxy core is the short exposure that was used to replaced the overexposed central region (see Sect. 3) and does not affect the colour profile in any way. |
| In the text | |
|
Fig. 7 (C − R) colour maps of NGC 5812. The top panel shows the entire galaxy and has the same dimensions as Fig. 2 (~9′ × 9′). The colour range shown is 1.1 ≲ (C − R) ≲ 2.5, with bluer colours darker, and redder colours lighter. It is clear that no strong colour gradient is present out to large radii. The lower panel shows the inner ~75″ × 75″ over a colour range of 1.71 ≲ (C − R) ≲ 1.80. The circular, redder region, ~15″ in diameter, as discussed in the text, is clearly visible. The noisy rectangular region surrounding the galaxy core is the short exposure that was used to replaced the overexposed central region (see Sect. 3) and does not affect the colour profile in any way. |
| In the text | |
Current usage metrics show cumulative count of Article Views (full-text article views including HTML views, PDF and ePub downloads, according to the available data) and Abstracts Views on Vision4Press platform.
Data correspond to usage on the plateform after 2015. The current usage metrics is available 48-96 hours after online publication and is updated daily on week days.
Initial download of the metrics may take a while.