| Issue |
A&A
Volume 549, January 2013
|
|
|---|---|---|
| Article Number | A90 | |
| Number of page(s) | 10 | |
| Section | Interstellar and circumstellar matter | |
| DOI | https://doi.org/10.1051/0004-6361/201220098 | |
| Published online | 03 January 2013 | |
Ammonia in the hot core W 51-IRS2: 11 new maser lines and a maser component with a velocity drift
1
Max-Planck-Institut für Radioastronomie,
Auf dem Hügel 69,
53121
Bonn,
Germany
e-mail: This email address is being protected from spambots. You need JavaScript enabled to view it.
2
Astronomy Department, Faculty of Science, King Abdulaziz
University, PO Box
80203, Jeddah,
Saudi Arabia
3
Naval Research Laboratory, Code 7210, Washington, DC
20375,
USA
4
Joint ALMA Observatory, Avda. Alonso de Córdova 3107, Vitacura,
Santiago de Chile,
Chile
Received: 24 July 2012
Accepted: 3 November 2012
Abstract
With the 100-m telescope at Effelsberg, 19 ammonia (NH3) maser lines have been detected toward the prominent massive star forming region W51-IRS2. Eleven of these inversion lines, the (J, K) = (6, 2), (5, 3), (7, 4), (8, 5), (7, 6), (7, 7), (9, 7), (10, 7), (9, 9), (10, 9), and (12, 12) transitions, are classified as masers for the first time in outer space. All detected masers are related to highly excited inversion doublets. The (5, 4) maser originates from an inversion doublet ~340 K above the ground state, while the (12, 12) transition, at ~1450 K, is the most highly excited NH3 maser line so far known. Strong variability is seen not only in ortho- but also in para-NH3 transitions. Bright narrow emission features are observed, for the first time, in (mostly) ortho-ammonia transitions, at VLSR ~ 45 km s-1, well separated from the quasi-thermal emission near 60 km s-1. These features were absent ~25 years ago and show a velocity drift of about +0.2 km s-1 yr-1. The component is likely related to the SiO maser source in W51-IRS2 and a possible scenario explaining the velocity drift is outlined. The 57 km s-1 component of the (9, 6) maser line is found to be strongly linearly polarised. Maser emission in the (J, K) to (J + 1, K) inversion doublets is strictly forbidden by selection rules for electric dipole transitions in the ground vibrational state. However, such pairs (and even triplets with (J + 2, K)) are common toward W51-IRS2. Similarities in line widths and velocities indicate that such groups of maser lines arise from the same regions, which can be explained by pumping through vibrational excitation. The large number of NH3 maser lines in W51-IRS2 is most likely related to the exceptionally high kinetic temperature and NH3 column density of this young massive star forming region.
Key words: masers / ISM: clouds / ISM: individual objects: W51 / HII regions / ISM: molecules / radio lines: ISM
© ESO, 2013
1. Introduction
Ammonia (NH3) provides the unique opportunity to trace molecular cloud excitation up to temperatures of ~2000 K by observing its characteristic inversion transitions within a very limited frequency interval (20–35 GHz; e.g. Ho & Townes 1983; Wilson et al. 2006, 2008). The inversion doublets arise from oscillations of the nitrogen nucleus through the plane of the three hydrogen nuclei. The frequencies of the lines connecting the two states of an inversion-doublet depend on the total angular momentum J and its projection on the molecular axis, K, with K = 0,3,6,9... belonging to ortho-NH3 and K = 1, 2, 4, 5, 7... representing para-NH3. Thus in the vibrational ground state, inversion doublets are characterized by the values J and K. The parities of the split levels differ to allow for the dipole transitions (J, K) → (J, K) (hereafter (J, K)), which are subject of this paper.
Dozens of inversion lines can be detected, provided kinetic temperatures and ammonia column densities are high enough. These conditions prevail in “hot cores”, dense molecular clumps near sites of very recent massive star formation (e.g., Mauersberger et al. 1986a, 1988b; Henkel et al. 1987b; Hermsen et al. 1988; Cesaroni et al. 1992; Hüttemeister et al. 1993, 1995; Wilson et al. 1993, 2000; Zhang & Ho 1997; Goddi et al. 2011). The NH3 abundances are believed to be caused by dust grain mantle evaporation (e.g., Henkel et al. 1987a; Walmsley et al. 1987; Brown et al. 1988). The warm dense clumps are characterized by temperatures Tkin > 100 K, X(NH3) = N(NH3)/N(H2) ~ 10−5...−6 and source averaged ammonia column densities in excess of 1018 cm-2.
Most but not all the ammonia inversion lines are thermally excited. (J,K) = (3, 3) maser emission was first detected by Wilson et al. (1982) toward the star forming region W 33. To date, several NH3 maser lines have been observed (e.g., Guilloteau et al. 1983; Madden et al. 1986; Mauersberger et al. 1988b; Hofner et al. 1994; Kraemer & Jackson 1995; Beuther et al. 2007), even including the rare isotopologue 15NH3 (Mauersberger et al. 1986b; Schilke et al. 1991).
A particularly outstanding hot core is associated with the star forming region W51-IRS 2, which includes W51-North, W51d, W51d1, and W51d2 (Zapata et al. 2009; their Fig. 1). At a distance of 6.1 ± 1.3 kpc (Imai et al. 2002) or  kpc (Xu et al. 2009), 1 pc subtends ~40′′. With a rotational temperature Trot ~ 300 K, a source averaged column density of N(NH3) ~ 1019 cm-2, and a virial density of n(H2) ~ 107.7 cm-3, W51-IRS2 is the source with the largest number of detected masing ammonia lines (Madden et al. 1986; Mauersberger et al. 1987; Wilson & Henkel 1988). Here we focus on such non-thermally excited lines and report results from monitoring observations spanning a time interval of almost two decades and leading to the detection of a dozen new molecular maser lines.
2. Observations
The data were taken in November and December 1995, October 2008, August 2011, and in April 2012 with the 100-m Effelsberg telescope1 near Bonn/Germany. At the line frequencies observed (18.5–31.4 GHz), the beam size is 49′′–29′′. The main beam brightness temperature scale was established by continuum cross scans toward 3C 286 and NGC 7027 (flux densities were adopted from Ott et al. (1984), also accounting for a 0.5% yr-1 secular decrease in the case of NGC 7027), while 1923+210 and 2145+06 were used as pointing sources. The pointing accuracy was better than 10′′. For maser sources much more compact than the beam size, line shapes are not affected by pointing errors. In 1995 and 1996, at frequencies above 26 GHz, a single channel primary focus HEMT (hot electron mobility transistor) receiver was employed with a system equivalent temperature on a Jansky scale of ~85 Jy, including sky and ground radiation. Later, measurements at K-band (18–26 GHz) were carried out with a dual channel (including both orthogonal linear polarizations) cooled primary focus HEMT receiver with a Tsys equivalent of ~65 Jy per channel.
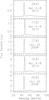 |
Fig. 1 NH3 spectra showing a new maser component near a local standard of rest (LSR) velocity of 45 km s-1. Note the slight velocity shifts in the (6, 6) and (7, 6) emission as a function of time (see Sect. 4.5). Less prominent quasi-thermal emission is centered near 60 km s-1. All spectra were taken at αB1950 = 19h21m22 |
Summary of NH3 maser observations.
For the early observations, the backend was a three level autocorrelator with 1024 spectral channels. Applied bandwidths ranged from 3.125 to 25 MHz. In 2008, and 2009, a fast Fourier transform spectrometer (FFTS) was employed with 16 384 channels for each polarization. Applied bandwidths were 50 and 500 MHz. For the most recent data another FFTS was used, this time with a bandwidth of 2 GHz and 32 768 channels per polarization. This allowed us to cover the entire 18–26 GHz range with a few frequency setups. Following weather conditions in a flexible way (measurements are much less weather dependent at 18–20 GHz than at higher frequencies), the frequency setup was changed quite often during the most recent observations with the 2 GHz backend. These covered parts of five consecutive days. Therefore, averaging data from several of these days, April 4–8, 2012, is mostly given as the epoch for these spectra.
All data were taken in the position switching mode, employing scans of 6 min total duration and offset positions 10′ east or west. The calibration uncertainties are estimated to be ±15% (1σ).
3. Results
3.1. Are there lines caused by maser action?
Figures 1–7 present spectra taken during a time interval of almost two decades, between 1995 and 2012. Shown is the complete set of maser transitions identified in the fully surveyed frequency interval between 18 and 26 GHz (with the two orthogonal polarizations being averaged) and by observations of the (9, 9), (10, 10), and (12, 12) transitions between 27.5 and 31.4 GHz. Lines, observing dates, channel spacings, and excitation above the ground state are summarized in Table 1. The characteristic rms noise level in a 0.7–1.0 km s-1 channel is of order 0.015 Jy. Note that the (3, 1) line at 22.23450 GHz is blended by the much stronger 61,6 → 52,3 line of H2O.
How can we be sure that each of the spectral lineshapes displayed is affected by population inversion? A strong argument favoring maser emission is a comparison of all detected lines. While Figs. 1–7 display data from a total of 19 NH3 inversion lines, a significantly larger number of such transitions was actually detected in the rich molecular spectrum toward W51-IRS2 (see the caption of Table 1). All these spectra, e.g. the metastable (J = K) (1, 1), (2, 2), ... (5, 5), and (10, 10) transitions exhibit the well known comparatively broad VLSR ~ 60 km s-1 feature (e.g., Mauersberger et al. 1987). Since its intensity is closely related to excitation of the respective levels above the ground state (Col. 5 of Table 1 for the lines discussed in the following) and since the feature is not time variable within the limits of accuracy over the last quarter of a century, the emission must be quasi-thermal.
Each of the 19 NH3 transitions discussed in this paper shows in addition to this quasi-thermal component at least one additional spectral feature. These features tend to be narrower and almost all of those observed repeatedly show signs of variability (see Sects. 4.2 and 4.3). Furthermore, none of these additional components is seen in the inversion lines with lowest excitation (e.g., (1, 1), (2, 2), (3, 3) or (5, 5)), which were part of the frequency survey in 2012. All this strongly hints at maser emission, since such features, if quasi-thermal, would have to be seen in all inversion lines below a given excitation level. We thus adopt the maser classification for all 19 transitions displayed in Figs. 1–7.
 |
Fig. 2 More NH3 spectra showing the new 45 km s-1 component (see also the caption to Fig. 1). In the second lowest panel, the features near 30 and 90 km s-1 are quasi-thermally excited satellite lines of the (7, 7) transition, caused by hyperfine splitting. |
3.2. The spectra
Among the 19 NH3 maser lines identified by us in W51-IRS2, 13 have not been reported before from this source. The (6, 3) and (9, 6) lines (Madden et al. 1986), the (5, 4), (7, 5), and (9, 8) lines (Mauersberger et al. 1987), and the (11, 9) line (Wilson & Henkel 1988) were known before this study. However, the non-thermal features in the (6, 2), (5, 3), (7, 4), (8, 5), (6, 6), (7, 6), (8, 6), (7, 7), (9, 7), (10, 7), (9, 9), (10, 9), and (12, 12) transitions are new discoveries in W51-IRS2, with the (12, 12) transition being the most highly excited NH3 maser line so far detected. Among the newly identified maser lines in W51-IRS2 only the (6, 6) and (8, 6) transitions have an analog in NGC 6334 (Beuther et al. 2007; Walsh et al. 2007) and possibly in IC 342 (Lebrón et al. 2011). All other lines have, to our knowledge, not yet been reported to show maser emission in outer space. The (7, 7) line is the first metastable (J = K) maser line seen in para-NH3. Figures 1–7 thus reveal eleven new molecular maser transitions.
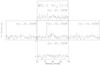 |
Fig. 4 A map of NH3 (J,K) = (7, 7) emission with a spacing of 30′′ toward W51-IRS2. The velocity scale is LSR, the ordinate gives flux density (Jy). North is up and east is left. For beam size and channel spacing, see Table 1. |
Figures 1–3 display spectra, which contain a previously absent (e.g., Mauersberger et al. 1987) NH3 velocity component in W51-IRS2, near a LSR velocity of VLSR = 45 km s-1. In most cases the broad quasi-thermal feature near 60 km s-1 is dwarfed, sometimes to such an extent, that it is only barely visible (e.g., Fig. 1). Figure 4 shows a five position map (spacing: 30′′) of the (J, K) = (7, 7) maser. Averaging the offset positions, the amplitude of the resulting signal relative to that from the central position is 0.18 ± 0.04. Using a Gaussian beam size of θb = 35′′, we obtain for a point source, in good agreement, a corresponding ratio of 0.14. Observations of the nearby source W51e in the (7, 7) line on October 23, 2008, showed no 45 km s-1 maser component. The same holds for a (6, 6) spectrum obtained on October 25, 2008, toward W51e. The 5σ limits are 0.27 Jy and 0.88 Jy in 0.71 km s-1 and 0.73 km s-1 channels, respectively.
Figure 5 displays spectra of the 45 km s-1 component obtained with high spectral resolution (see also Sect. 4.5). While the (12, 12) spectrum from November 1995 has been smoothed, the original data, albeit being noisy, indicate that the line is as broad as the (9, 9) feature measured at the same epoch. Figures 6 and 7 show spectra of ammonia lines with maser features being closer to the quasi-thermal “systemic” emission peaking near 60 km s-1. Interestingly, the (3, 3) and (10, 8) lines, previously reported to exhibit maser emission at ~54 km s-1 (Mauersberger et al. 1987; Zhang & Ho 1995), now show exclusively the quasi-thermal 60 km s-1 component (Fig. 8). While this requires a real change in the overall (10, 8) line shape, the (3, 3) maser was discovered through interferometric measurements and may be too weak and too close in frequency to the peak of the quasi-thermal emission to be detectable with single-dish telescopes.
A comparison of the two linearly polarized components of the masers measured between 18 and 26 GHz shows no significant differences in line shape in almost all cases. The exception is the (9, 6) line, where the 57 km s-1 component appears to be highly polarized (see Fig. 9). An alternative explanation, that there exist two maser sources and that there is a beam squint between the two orthogonal polarisations, causing the different line shapes, can be excluded. Pointing and calibration measurements (Sect. 2) do not show any such position offset.
4. Discussion
4.1. General considerations
We have covered the entire 18–26 GHz frequency band, which includes all ammonia inversion doublets with low excitation. Nevertheless, when employing a θb ~ 40′′ beam, Table 1 unambiguously tells us that only highly excited ammonia inversion doublets exhibit velocity components with inverted populations. Among the 19 detected maser lines, the (J,K) = (5,4) line at E ~ 340 K is closest to the ground state.
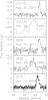 |
Fig. 5 High velocity resolution spectra of NH3 maser transitions showing the new ~45 km s-1 component. The upper and central profiles are extracted from Figs. 2 and 3, respectively. The second panel from the top shows a profile with eight contiguous channels smoothed (channel spacing: 0.96 km s-1, otherwise, see Table 1). The original spectrum, albeit noisy, indicates a line width consistent with that shown in the spectrum of the (9, 9) line measured on the same day. The Gaussian fit parameters of the (12, 12) spectrum from November 28, 1995, given in Table 1, were deduced from the original unsmoothed spectrum. |
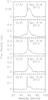 |
Fig. 6 NH3 maser spectra taken from W51-IRS2 not showing the 45 km s-1 maser component. For beam sizes and channel spacings, see Table 1. |
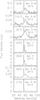 |
Fig. 7 NH3 maser spectra taken from W51-IRS2 not showing the 45 km s-1 maser component (see also Fig. 6). |
Another remarkable feature is the number of ortho- versus para-NH3 maser lines. Even though para-NH3 inversion doublets (K = 1, 2, 4, 5, 7, 8...) are twice as numerous as ortho-NH3 doublets (K = 3, 6, 9...; the K = 0 ladder is characterized by singlets), we get ten ortho- and only 9 para-NH3 maser transitions. This may be understood in view of two important differences between the ortho- and para-species. Firstly, the ortho levels have twice the statistical weight, thus providing larger column densities and possibly higher maser amplification factors for ortho-to-para abundance ratios of order unity (e.g., Umemoto et al. 1999; Goddi et al. 2011). Secondly, as already mentioned, the K = 0 ladder contains single rotational states. In the gas phase, ortho- and para-NH3 can exchange only very slowly (e.g., Cheung et al. 1969). The ortho-NH3K = 0 single states therefore connect to one of the two levels in a K = 3 inversion doublet, thus providing potentially significant deviations from quasi-thermally balanced populations at K = 3 (e.g., Walmsley & Ungerechts 1983). Within this context it is worth mentioning that the two strongest maser lines, those from the (6, 6) and (9, 6) inversion doublets, belong to the ortho-species.
Another noteworthy fact is that among the 19 maser lines detected by us, only four are metastable (J = K): three ortho-NH3 [(6, 6), (9, 9), and (12, 12)] transitions and one para-NH3 [(7, 7)] line (see Table 1). The vast majority of the maser lines detected in this study originates from non-metastable inversion doublets (J > K). Their populations decay rapidly to the metastable levels, so their excitation is complex and either requires extremely high densities (≳106 cm-3) and/or an intense infrared radiation field.
4.2. Variability on short time scales
We seached for changes in the line profiles of our spectral broadband survey during April 4–8, 2012. The (5, 3), (5, 4), (7, 5), (7, 6), (8, 6), (9, 7), and (11, 9) transitions remained stable, within the calibration uncertainties (Sect. 2), over a time interval of four days. For the (6, 3), (7, 4), (6, 6), and (7, 7) lines the same holds for an interval of three days, while we see no significant change in the (6, 2), (8, 5), (9, 8), and (10, 9) transitions (and in the (7, 7) transition in October 2008, see Figs. 2 and 4) after two days. However, the (9, 6) line shows a significant variation in line shape within a time interval of only two days (Fig. 7). To our knowledge this is the fastest variation so far seen in an ammonia maser and might indicate that the maser is due to exponential amplification of radiation, that is unsaturated. Since it is one of the two strongest ammonia masers toward W51-IRS2, we could then speculate that all the 19 masers we have found are unsaturated. However, data with higher angular resolution are definitely needed to further clarify this point (see, e.g., the arguments of Wilson et al. 1991, favoring a saturated (9, 8) maser line).
We can assume that the time scale for intensity variations is equal to the light travel time across the source. The main variation in the (9, 6) line is seen near 55 km s-1. If we take a flux density of S ~ 2 Jy (Fig. 7), a beam size of 48.6′′ (see caption to Table 1), a flux to main beam brightness temperature conversion factor of 1.5, and a distance of 5 kpc (see Sect. 1), we then obtain an angular scale of order 0.1′′ and a corresponding brightness temperature of order 106 K, similar to the limit obtained for the (9, 8) line by Gaume et al. (1993).
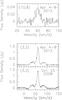 |
Fig. 8 The two previously reported maser lines from W51-IRS2 (Mauersberger et al. 1987; Zhang & Ho 1995), which were found to only exhibit quasi-thermal emission. The triple component line shape of the NH3 (3, 3) transition is caused by hyperfine splitting. Channel spacings are 0.88 km s-1 for the (10, 8) and 0.77 km s-1 for the (3, 3) profiles, respectively. |
4.3. Variability on long time scales
Beside the VLSR ~ 62 km s-1 component of the (J,K) = (9,6) transition (Fig. 9), which is too intense and time variable to be of quasi-thermal origin (cf. Madden et al. 1985; Wilson et al. 1988), there are three additional families of maser lines. These show emission near 57 km s-1, near 54.5 km s-1, and near 45 km s-1 (see Table 1). In the following we discuss all components in order of decreasing velocity.
High velocity features (≳60 km s-1) were observed by Madden et al. (1986) and Wilson & Henkel (1988) in W51-IRS2. The Madden et al. (9, 6) spectrum from late 1984 or early 1985 shows about half a dozen of narrow spikes between 50 and 62 km s-1. Flux densities are a few Jy. In this case, however, the angular resolution is 96′′, so that the neighboring W51e region is also inside the beam (see, e.g., Fig. 1 of Gaume et al. 1993). In September 1987, Wilson & Henkel (1988), using the Effelsberg telescope and therefore exclusively measuring the W51-IRS2 region, find a particularly strong component (~10 Jy) near VLSR ~ 65 km s-1, which is, however, absent in July 1988.
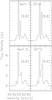 |
Fig. 9 Linear polarisation in the 57 km s-1 component of the (9, 6) maser line on April 5 and 7, 2012. Shown are the two orthogonal components. The left panels display the horizontal (approximately east-west) and the right panels the vertical (approximately north-south) component, because the line was observed close to transit. Since the line is strong, the difference is highly significant and is visible in each of the 20 (April 5) and 60 (April 7) individual subscans. For beam size and channel spacing, see Table 1. |
VLSR ~ 57 km s-1 masers are seen in the (5, 3), (6, 3), (5, 4), and (9, 6) transitions, i.e. mostly in ortho-NH3. There is rapid variability in the (9, 6) line (see previous subsection). In the eighties (Madden et al. 1986; Wilson & Henkel 1988), (6, 3) emission was seen at 54 km s-1. The line has switched from one group of maser components to another. The (5, 4) feature has varied little during the past quarter of a century, while maser emission from the (11, 9) line, detected between August 1986 and October 1986 (Wilson & Henkel 1988), is not present in more recent spectra.
The 54.5 km s-1 velocity component is found in eight maser lines, namely in the (6, 2), (7, 4), (7, 5), (8, 5), (9, 6), (9, 7), (10, 7), and (9, 8) transitions. In earlier studies, also (3, 3), (10, 8), and (11, 9) maser emission has been reported (Mauersberger et al. 1987; Wilson & Henkel 1988; Zhang & Ho 1995). The (6, 3) line, which 25 years ago also contributed to the 54.5 km s-1 group of masers (Madden et al. 1986), is now seen at ~57 km s-1 (see above). Except the (9, 6) transition, all lines belong to the para-NH3 species. Mauersberger et al. (1987) searched for (6, 2) emission but the line remained undetected. Their upper limit, 0.1 Jy, is well below the 0.3 Jy signal we have found. The (7, 5) and (9, 7) transitions did also not show a maser component (see Fig. 1 of Mauersberger et al. 1987). However, in July 1988, Wilson & Henkel (1988) detected a 0.4 Jy maser feature in the (7, 5) line. Since then, the maser peak flux density has increased sixfold. The opposite trend, decreasing intensities with time, is seen in the (11, 9), (9, 8), and (10, 8) lines. (11, 9) maser emission was observed in 1986 (Wilson & Henkel 1988) but has faded. The (9, 8) and (10, 8) lines were much stronger ~25 years ago. For the (9, 8) line, already Wilson et al. (1991) reported a moderate decrease by ~30% relative to measurements during the previous years. Now the decline has reached 90% and the previously observed (10, 8) maser is now below our detection threshold.
Another eight transitions, the (6, 6), (7, 6), (8, 6), (7, 7), (9, 9), (10, 9), (11, 9), and (12, 12) lines, belong to the VLSR ~45 km s-1 group. Almost all of these are ortho-NH3 transitions, again with one notable exception, this time the (7, 7) line. The 45 km s-1 component is the only one not seen in the (9, 6) maser transition. For the broad quasi-thermal (8, 6) feature near 60 km s-1 Mauersberger et al. (1987) proposed anti-inversion, implying a low but still positive excitation temperature and a high optical depth. It is thus remarkable that we find now, near 45 km s-1, strong (8, 6) maser emission. In the (9, 9) and (12, 12) lines, which have been repeatedly measured, there is a tendency of rising peak flux densities in more recent observations. On the contrary, in spring 2012, the (7, 7) line has dramatically weakened, revealing a previously unseen second maser feature (Fig. 2).
4.4. Constraints for pumping scenarios
We noted in Sect. 4.2 that all observed masers in W51-IRS2 might be unsaturated. Wilson et al. (1991) proposed instead saturated emission in the case of the (9, 8) line. The two arguments were a large line width (~0.4 km s-1; Wilson & Henkel 1988) and constant peak flux density. In the meantime, however, the line has varied substantially and the line width is rather narrow. Measuring the line widths of all detected masers and comparing these, if possible, with previously taken data with high spectral resolution will reveal the correlation between line width and peak flux density and will thus provide a definite answer to the question of maser saturation. This is part of a follow-up study.
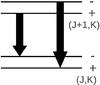 |
Fig. 10 Selection rules for purely rotational transitions between two NH3 inversion doublets belonging to the same K-ladder. Parities are given on the right hand side. |
Figure 10 illustrates an important rule for radiative dipole transitions within a K-ladder containing NH3 inversion doublets. The upper level of the upper doublet (the (J + 1, K) inversion doublet) is directly connected to the lower level of the lower doublet (J,K) and vice versa. Thus, if the upper doublet is inverted, the lower doublet should be anti-inverted.
This is not confirmed by our measurements. The maser emission at 57 km s-1 is observed in the (5, 3) and (6, 3) transitions. The 54.5 km s-1 component is seen in the (7, 5) and (8, 5) and in the (9, 7) and (10, 7) lines. In case of the 45 km s-1 component, we even find the (6, 6), (7, 6), (8, 6) and the (9, 9), (10, 9), (11, 9) transitions. It appears as if, contradicting the above mentioned rule, the combination of (J + 1, K) and (J,K) masers is not forbidden but actually preferred. The former presence of the (9, 8) and (10, 8) maser lines and their simultaneous weakening also points into this direction, even though truly systematic variability studies of such maser pairs are still not available.
As already noted by Madden et al. (1986), there are three main pumping schemes which could, in principle, explain the observed NH3 maser emission. These are (1) line overlap; (2) pumping by infrared radiation from the dust; and (3) pumping by collisions. Simulations of NH3 maser emission encounter several problems. One is that collision rates are only known for inversion levels J ≤ 6 (e.g., Danby et al. 1988). Another is the spectrum of the infrared radiation field. For vibrational excitation of NH3 by IR photons near λ = 10 μm (see Bally et al. 1987), the silicate dust feature may significantly perturb the radiation field, making any prediction highly speculative (Brown & Cragg 1991). Madden et al. (1986) suggested for the NH3 (10, 6)+–(9, 6)− and (10, 6)−–(9, 6)+ transitions, the upper indices denoting parity, line overlaps. Such blends, if they are not common and only affect the (9, 6) line, may explain the very particular behavior of this inversion line. Each maser family (Sect. 4.3) is mostly composed of either ortho- or para-NH3 transitions. This indicates that the two ammonia species are, as expected, reasonably well separated.
Schilke (1989) extrapolated NH3 collision rates to high-J levels and even included vibrational excitation (the v2 = 1 level), finding that vibrationally excited levels strongly affect the excitation of ground state inversion lines. For Tdust ~ Tkin, excitation temperatures can raise well above Tdust and Tkin, in particular when temperatures above 160–180 K are being reached. The latter does not hold for the bulk of the NH3 bearing gas in Orion-KL (Hermsen et al. 1988) but is realized in W51-IRS2 (Mauersberger et al. 1987). Interestingly, Schilke (1989) mentions the (9, 8) line, which is easily inverted under such conditions, while the (10, 8) line should not become a maser. This is consistent with our data from April 2012 (Figs. 7 and 8), but inconsistent with previous data also showing the (10, 8) line to be inverted (Mauersberger et al. 1987).
Brown & Cragg (1991) also studied the influence of vibrational excitation on the ground state transitions. They could reproduce (6, 3) maser emission and predicted quasi-thermal emission for the (4, 3) and (5, 3) lines. While the former is consistent with our data, the latter is not (see Fig. 6), so that our data do not fully confirm their model in the case of W51-IRS2.
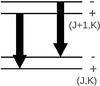 |
Fig. 11 Pseudo-selection rules for rotational transitions between two NH3 inversion doublets belonging to the same K-ladder, when vibrational excitation is involved. Parities are given on the right hand side. Excitation into a vibrationally excited level and subsequent decay leads to ΔJ = 0, ±1, and ±2 pseudo-transitions without parity change in the ground state. Shown are two R-branch transitions with ΔJ = −1. |
Following Schilke (1989), vibrational excitation leads to pseudo-selection rules in the ground state, where then ΔJ = 0, ±1, and ±2 “transitions” are allowed without parity change. This directly contradicts the selection rules illustrated in Fig. 10 and leads to the situation in Fig. 11, which predicts maser emission in several adjacent J levels within a K-ladder, as observed. We conclude that the measured series of masers in (J, K) and (J + 1, K) lines, sometimes also including (J + 2, K), are a direct consequence of vibrational excitation. Such a scenario was already proposed for the (3, 3) and (4, 3) lines of 15NH3 in NGC 7538-IRS1 (Schilke et al. 1991). However, our case with several pairs and even triples of maser lines within a given K-ladder is a much more convincing one. The apparent contradiction to Schilke with respect to the (10, 8) line may be a result of insufficient knowledge of collisional parameters (available only up to the (6, 6) line; Danby et al. 1988), spatial fine structure, and the radiation field.
4.5. NH3 masers, the ambient molecular cloud, and a feature with velocity drift
Interferometric measurements to determine accurate positions have been carried out for the (3, 3) and (9, 8) maser lines (Gaume et al. 1993; Zhang & Ho 1995). The (3, 3) and (9, 8) positions (αJ2000 ~ 19h23m39 8, δJ2000 ~ +14°31m05.0′′) agree within the uncertainties of up to one arcsecond and may represent the position for the entire family of 54.5 km s-1 maser lines (see Sect. 4.3). These are associated with an ultracompact HII region (Wilson et al. 1991) that is also known to show 6.7 GHz methanol emission (Phillips & van Langevelde 2005). For the family of 57 km s-1 masers an accurate position is not yet known.
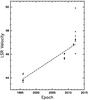 |
Fig. 12 Radial velocity versus epoch for the VLSR ~ 45 km s-1 component with the data from Table 1. The dashed line provides an approximate drift, based on the average velocity obtained in November 1995 and in April 2012. For the latter epoch, the high velocity feature (VLSR = 49.9 km s-1) in the (7, 7) line (Fig. 2) was considered as an outlier and was not part of the average. |
While frequently seen in late-type stars, W51-IRS2 is one of only three star forming regions known to show SiO maser emission (Snyder & Buhl 1974; Hasegawa et al. 1986). Such emission originates from vibrationally excited levels more than 1000 K above the ground state and thus requires highly excited gas (e.g., Goddi et al. 2009). There are no high NH3 resolution data to prove a spatial correlation between ~45 km s-1 NH3 and SiO emission. However, there is a 45 km s-1 component seen in the SiO v = 2 J = 1 → 0 maser line, possibly tracing an accelerating bipolar outflow close to the obscured protostar W51-North (Eisner et al. 2002; Zapata et al. 2009). The possible correlation between the highly excited 45 km s-1v = 2 SiO maser component (αJ2000 = 19h23m4006, δJ2000 = + 14°31m05.6′′) and NH3 is supported by the fact that the ~45 km s-1 NH3 masers are those with highest excitation, including the (12, 12) transition at E/k ~ 1450 K (Table 1).
Also related to this component, and perhaps the most striking aspect of our observations, is the velocity drift of the measured ~45 km s-1 NH3 features with time. This is seen in Figs. 1–3 and even more so in Fig. 5. The drift is of order +0.2 km s-1 yr-1 (Fig. 12). For July 1994, extrapolating the dashed line connecting data from 1995 and 2012, we find a velocity of VLSR ~ 43.5 km s-1. For July 1998, VLSR ~ 44.5 km s-1. Both values correspond to distinct SiO maser velocity components (Eisner et al. 2002), detected at these two epochs and might be related to the lower velocity SiO feature monitored by Fuente et al. (1989; their Fig. 2), which shows a redward drift of order 0.4–0.5 km s-1 yr-1 between 1985 and 1989. In 1994, the NH3 maser velocity is consistent with the strongest SiO maser feature observed by Eisner et al. (2002), if we neglect the potential influence of missing flux in these high resolution data. All this supports a spatial correlation between SiO and the 45 km s-1 NH3 maser component.
From SiO, Eisner et al. (2002) have identified a linear structure with a northern (more blue-shifted) and southern (more red-shifted) arm along a position angle of ~105° with a velocity gradient of about 0.1 km s-1 AU-1 along each arm. Assuming that the 45 km s-1 NH3 feature is an outflow region or a bullet belonging to this structure, the NH3 velocity drift would correspond to a motion of 2 AU yr-1, roughly eastwards along PA ~ 105°.
Eisner et al. (2002) interpreted the SiO distribution in terms of an accelerating outflow from a deeply obscured massive stellar source with a 3-dimensional acceleration of 0.5 km s-1 yr-1 and 0.2 km s-1 yr-1 projected along the line-of-sight. The latter agrees remarkably well with our ammonia data (Fig. 12). The agreement is so good that we refrain from suggesting any other model as long as future interferometric NH3 measurements are not indicating a clearly different scenario.
Considering the proposed association of SiO and NH3 masers, we may ask whether such a phenomenon may be common. Toward W51-IRS2, one out of several NH3 maser velocity components appears to be related. Toward the other two star forming SiO maser sources, Orion-KL and Sgr B2 (Hermsen et al. 1988; Hüttemeister et al. 1993; Goddi et al. 2011), such NH3 masers are not observed. The same holds for the circumstellar envelopes of late-type stars, which do not show NH3 maser emission. This implies that we have detected a new phenomenon which might be rare. However, the number of known star forming regions exhibiting SiO maser emission is still too small to provide a sound statistical basis.
4.6. Why does W51-IRS2 host so many ammonia maser sources?
A question still to be addressed is why does W51-IRS2 host so many NH3 masers? One potentially useful property may be a fortuitous spatial configuration, with the densest part of the molecular hot core being located in front of an Hii region (this may, however, not be the case for the 45 km s-1 component if it is associated with the SiO source, Eisner et al. 2002). Another ingredient is likely the extremely high column density of NH3 (Sect. 1), which certainly facilitates the build up of sufficient maser intensity. This holds in particular in the case of unsaturated maser emission (see Sects. 4.2 and 4.4), where larger column densities lead to exponential effects. Possibly most important, however, is the kinetic temperature of the bulk of the ammonia emitting gas. With Tkin ~ 300 K (Mauersberger et al. 1987), it is much higher than, for example, in Orion-KL (Hermsen et al. 1988). This high temperature at densities, where dust and gas temperatures are likely coupled, facilitates vibrational excitation by infrared photons near 10 μm (see Sect. 4.4). This may cause significant deviations from quasi-thermal conditions in the ground state (Schilke 1989; see also Mauersberger et al. 1988a; and Schilke et al. 1990, 1992, for vibrationally excited NH3 in the cooler Orion-KL hot core). Line overlaps may also play a role. Note that the excitation above the ground state of the NH3 (12, 12) maser line (Figs. 2 and 5) is of the same order of magnitude as that of the first vibrationally excited state.
5. Conclusions
Using the 100-m telescope at Effelsberg, we have searched for NH3 maser emission in the prominent massive star forming region W51-IRS2. The main results from this study, covering 16 years of monitoring, are briefly mentioned:
-
A total of 19 NH3 maser lines was detected. Eleven of these inversion transitions have been identified as masers for the first time in the interstellar medium.
-
The (9, 6) line has been found to vary significantly during a time interval of only two days. This is the fastest change so far detected in an ammonia maser. Furthermore, its 57 km s-1 velocity component shows strong linear polarisation, which is not found in any of the other lines. While variations in other transitions are slower, not only ortho- but also para-NH3 transitions show drastic changes during the last 16 years. The (12, 12) line, at ~1450 K above the ground state, is the most highly excited ammonia maser line so far detected.
-
Apart from the (9, 6) line, which is unique among the 19 transitions reported here, there are three families of maser transitions, those exhibiting emission at 57, 54.5 and 45 km s-1. The latter family was not known previously.
-
There are many maser pairs in the same K ladder, such as (J,K) and (J + 1, K). In some cases, this extends to a triple, including (J + 2, K). This observation gives strong support for vibrational excitation, induced by λ ~ 10 μm photons, as the main pumping mechanism.
-
The 45 km s-1 component masers show a secular drift of about 0.2 km s-1 yr-1 and may arise close to the SiO maser source. Possible scenarios explaining the drift in terms of outflowing gas or orbital motion are outlined.
-
The most likely reason that W51-IRS2 hosts many more NH3 masers than any other known source is the combination of a very high temperature (~300 K, ideal for 10 μm photons needed to vibrationally excite NH3), an exceptionally high NH3 column density, and possibly also a fortuitous location with respect to continuum sources such as hyper-compact Hii regions.
Besides measuring accurate line widths of many of the newly discovered maser lines to discriminate between saturated and unsaturated maser emission, the most important follow-up will be high angular resolution measurements. Only these will allow us to determine precise positions, which are essential to interprete the data in a broader context, also including other astrophysical tracers, and to explain the origin of the enigmatic velocity drift.
Based on observations with the 100-m telescope of the MPIfR (Max-Planck-Institut für Radioastronomie) at Effelsberg.
Acknowledgments
We wish to thank A. Kraus for helpful comments related to the data taken at the Effelsberg 100-m telescope. We are also happy to thank C. Goddi and C. M. Walmsley for carefully reading the manuscript and providing excellent comments.
References
- Bally, J., Arens, J. F., Ball, R., Becker, R., & Lacy, J. 1987, ApJ, 323, L73 [NASA ADS] [CrossRef] [Google Scholar]
- Beuther, H., Walsh, A. J., Thorwirth, S., et al. 2007, A&A, 466, 989 [NASA ADS] [CrossRef] [EDP Sciences] [Google Scholar]
- Brown, R. D., & Cragg, D. M. 1991, ApJ, 378, 445 [NASA ADS] [CrossRef] [Google Scholar]
- Brown, P. D., Charnley, S. B., & Millar, T. J. 1988, MNRAS, 231, 409 [NASA ADS] [CrossRef] [Google Scholar]
- Cesaroni, R., Walmsley, C. M., & Churchwell, E. 1992, A&A, 256, 618 [NASA ADS] [Google Scholar]
- Cheung, A. C., Rank, D. M., Townes, C. H., Knowles, S. H., & Sullivan, W. T. 1969, ApJ, 157, L13 [NASA ADS] [CrossRef] [Google Scholar]
- Danby, G., Flower, D. R., Valiron, P., Schilke, P., & Walmsley, C. M. 1988, MNRAS, 235, 229 [NASA ADS] [CrossRef] [Google Scholar]
- Eisner, J. A., Greenhill, L. J., Herrnstein, J. R., Moran, J. M., & Menten, K. M. 2002, ApJ, 569, 334 [NASA ADS] [CrossRef] [Google Scholar]
- Fuente, A., Martín-Pintado, J., Alcolea, J., & Barcia, A. 1989, A&A, 223, 321 [NASA ADS] [Google Scholar]
- Gaume, R. A., Johnston, K. J., & Wilson, T. L. 1993, ApJ, 417, 645 [NASA ADS] [CrossRef] [Google Scholar]
- Goddi, C., Greenhill, L. J., Chandler, C. J., et al. 2009, ApJ, 698, 1165 [NASA ADS] [CrossRef] [Google Scholar]
- Goddi, C., Greenhill, L. J., Humphreys, E. M. L., Chandler, C. J., & Matthews 2011, ApJ, 739, L13 [NASA ADS] [CrossRef] [Google Scholar]
- Guilloteau, S., Wilson, T. L., Martin, R. N., Batrla, W., & Pauls, T. A. 1983, A&A, 124, 322 [NASA ADS] [Google Scholar]
- Greenhill, L. J., Henkel, C., Becker, R., Wilson, T. L., & Wouterloot, J. G. A. 1995, A&A, 304, 21 [NASA ADS] [Google Scholar]
- Haschick, A. D., Baan, W. A., & Peng, E. W. 1994, ApJ, 437, L35 [NASA ADS] [CrossRef] [Google Scholar]
- Hasegawa, T., Morita, K., Okumura, S., et al. 1986, in Masers, Molecules, and Mass Outflows in Star Forming Regions, ed. A. D. Haschick (Westford: Haystack), 275 [Google Scholar]
- Henkel, C., Mauersberger, R., Wilson, T. L., et al. 1987a, A&A, 182, 299 [NASA ADS] [Google Scholar]
- Henkel, C., Wilson, T. L., & Mauersberger, R. 1987b, A&A, 182, 137 [NASA ADS] [Google Scholar]
- Hermsen, W., Wilson, T. L., Walmsley, C. M., & Henkel, C. 1988, A&A, 201, 285 [NASA ADS] [Google Scholar]
- Ho, P. T. P., & Townes, C. H. 1983, ARA&A, 21, 239 [NASA ADS] [CrossRef] [Google Scholar]
- Hofner, P., Kurtz, S., Churchwell, E., Walmsley, C. M., & Cesaroni, R. 1994, A&A, 429, L85 [Google Scholar]
- Hüttemeister, S., Wilson, T. L., Henkel, C., & Mauersberger, R. 1993, A&A, 276, 445 [NASA ADS] [Google Scholar]
- Hüttemeister, S., Wilson, T. L., Mauersberger, R., et al. 1995, A&A, 294, 667 [NASA ADS] [Google Scholar]
- Imai, H., Watanabe, T., Omodaka, T., et al. 2002, PASJ, 54 741 [NASA ADS] [Google Scholar]
- Kraemer, K. E., & Jackson, J. M. 1995, ApJ, 439, L9 [NASA ADS] [CrossRef] [Google Scholar]
- Lebrón, M., Mangum, J. G., Mauersberger, R., et al. 2011, A&A, 534, A56 [NASA ADS] [CrossRef] [EDP Sciences] [Google Scholar]
- Madden, S. C., Irvine, W. A., Matthews, H. E., Brown, R. D., & Godfrey, P. D. 1986, ApJ, 300, L79 [NASA ADS] [CrossRef] [Google Scholar]
- Mauersberger, R., Henkel, C., Wilson, T. L., & Walmsley, C. M. 1986a, A&A, 162, 199 [NASA ADS] [Google Scholar]
- Mauersberger, R., Wilson, T. L., & Henkel, C. 1986b, A&A, 160, L13 [NASA ADS] [Google Scholar]
- Mauersberger, R., Henkel, C., & Wilson, T. L. 1987, A&A, 173, 352 [NASA ADS] [Google Scholar]
- Mauersberger, R., Henkel, C., & Wilson, T. L. 1988a, A&A, 205, 235 [NASA ADS] [Google Scholar]
- Mauersberger, R., Wilson, T. L., & Henkel, C. 1988b, A&A, 201, 123 [NASA ADS] [Google Scholar]
- Miyoshi, M., Moran, J., Herrnstein, J., et al. 1995, Nature, 373, 127 [NASA ADS] [CrossRef] [Google Scholar]
- Ott, M., Witzel, A., Quirrenbach, A., et al. 1984, A&A, 284, 331 [Google Scholar]
- Phillips, C., & van Langevelde, H. J. 2005, Ap&SS, 295, 225 [NASA ADS] [CrossRef] [Google Scholar]
- Schilke, P. 1989, Diploma Thesis, Ammoniak in warmen Molekülwolken, Univ. of Bonn/Germany [Google Scholar]
- Schilke, P., Walmsley, C. M., Wilson, T. L., & Mauersberger, R. 1990, A&A, 227, 220 [NASA ADS] [Google Scholar]
- Schilke, P., Walmsley, C. M., & Mauersberger, R. 1991, A&A, 247, 516 [NASA ADS] [Google Scholar]
- Schilke, P., Güsten, R., Schulz, A., Serabyn, E., & Walmsley, C. M. 1992, A&A, 261, L5 [NASA ADS] [Google Scholar]
- Snyder, L. E., & Buhl, D. 1974, ApJ, 189, L31 [NASA ADS] [CrossRef] [Google Scholar]
- Umemoto, T., Mikami, H., Yamamoto, S., & Hirano, N. 1999, ApJ, 525, L105 [NASA ADS] [CrossRef] [PubMed] [Google Scholar]
- Walmsley, C. M., & Ungerechts, H. 1983, A&A, 122, 164 [NASA ADS] [Google Scholar]
- Walmsley, C. M., Hermsen, W., Henkel, C., et al. 1987, A&A, 172, 311 [NASA ADS] [Google Scholar]
- Walsh, A. J., Longmore, S. N., Thorwirth, S., Urquhart, J. S., & Purcell, C. R. 2007, MNRAS, 382, L35 [NASA ADS] [Google Scholar]
- Wilson, T. L., & Henkel, C. 1988, A&A, 206, L26 [NASA ADS] [Google Scholar]
- Wilson, T. L., Batrla, W., & Pauls, T. A. 1982, A&A, 110, L20 [NASA ADS] [Google Scholar]
- Wilson, T. L., Gaume, R., & Johnston, K. J. 1991, A&A, 251, L7 [NASA ADS] [Google Scholar]
- Wilson, T. L., Henkel, C., Hüttemeister, S., et al. 1993, A&A, 276, L29 [NASA ADS] [Google Scholar]
- Wilson, T. L., Gaume, R. A., Gensheimer, P., & Johnston, K. J. 2000, A&A, 251, L7 [Google Scholar]
- Wilson, T. L., Henkel, C., & Hüttemeister, S. 2006, A&A, 460, 533 [NASA ADS] [CrossRef] [EDP Sciences] [Google Scholar]
- Wilson, T. L., Rohlfs, K., & Hüttemeister, S. 2008, Tools of Radio Astronomy, 5th edn. (Springer), 404 [Google Scholar]
- Xu, Y., Reid, M. J., Menten, K. M., et al. 2009, A&A, 693, 413 [Google Scholar]
- Zapata, L. A., Ho, P. T. P., Schilke, P., et al. 2009, ApJ, 698, 1422 [NASA ADS] [CrossRef] [Google Scholar]
- Zhang, Q., & Ho, P. T. P. 1995, ApJ, 450, L63 [NASA ADS] [CrossRef] [Google Scholar]
- Zhang, Q., & Ho, P. T. P. 1997, ApJ, 488, 241 [NASA ADS] [CrossRef] [Google Scholar]
All Tables
All Figures
|
Fig. 1 NH3 spectra showing a new maser component near a local standard of rest (LSR) velocity of 45 km s-1. Note the slight velocity shifts in the (6, 6) and (7, 6) emission as a function of time (see Sect. 4.5). Less prominent quasi-thermal emission is centered near 60 km s-1. All spectra were taken at αB1950 = 19h21m22 |
| In the text | |
|
Fig. 2 More NH3 spectra showing the new 45 km s-1 component (see also the caption to Fig. 1). In the second lowest panel, the features near 30 and 90 km s-1 are quasi-thermally excited satellite lines of the (7, 7) transition, caused by hyperfine splitting. |
| In the text | |
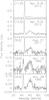 |
Fig. 3 Additional NH3 spectra showing the new 45 km s-1 component (see also Figs. 1 and 2). |
| In the text | |
|
Fig. 4 A map of NH3 (J,K) = (7, 7) emission with a spacing of 30′′ toward W51-IRS2. The velocity scale is LSR, the ordinate gives flux density (Jy). North is up and east is left. For beam size and channel spacing, see Table 1. |
| In the text | |
|
Fig. 5 High velocity resolution spectra of NH3 maser transitions showing the new ~45 km s-1 component. The upper and central profiles are extracted from Figs. 2 and 3, respectively. The second panel from the top shows a profile with eight contiguous channels smoothed (channel spacing: 0.96 km s-1, otherwise, see Table 1). The original spectrum, albeit noisy, indicates a line width consistent with that shown in the spectrum of the (9, 9) line measured on the same day. The Gaussian fit parameters of the (12, 12) spectrum from November 28, 1995, given in Table 1, were deduced from the original unsmoothed spectrum. |
| In the text | |
|
Fig. 6 NH3 maser spectra taken from W51-IRS2 not showing the 45 km s-1 maser component. For beam sizes and channel spacings, see Table 1. |
| In the text | |
|
Fig. 7 NH3 maser spectra taken from W51-IRS2 not showing the 45 km s-1 maser component (see also Fig. 6). |
| In the text | |
|
Fig. 8 The two previously reported maser lines from W51-IRS2 (Mauersberger et al. 1987; Zhang & Ho 1995), which were found to only exhibit quasi-thermal emission. The triple component line shape of the NH3 (3, 3) transition is caused by hyperfine splitting. Channel spacings are 0.88 km s-1 for the (10, 8) and 0.77 km s-1 for the (3, 3) profiles, respectively. |
| In the text | |
|
Fig. 9 Linear polarisation in the 57 km s-1 component of the (9, 6) maser line on April 5 and 7, 2012. Shown are the two orthogonal components. The left panels display the horizontal (approximately east-west) and the right panels the vertical (approximately north-south) component, because the line was observed close to transit. Since the line is strong, the difference is highly significant and is visible in each of the 20 (April 5) and 60 (April 7) individual subscans. For beam size and channel spacing, see Table 1. |
| In the text | |
|
Fig. 10 Selection rules for purely rotational transitions between two NH3 inversion doublets belonging to the same K-ladder. Parities are given on the right hand side. |
| In the text | |
|
Fig. 11 Pseudo-selection rules for rotational transitions between two NH3 inversion doublets belonging to the same K-ladder, when vibrational excitation is involved. Parities are given on the right hand side. Excitation into a vibrationally excited level and subsequent decay leads to ΔJ = 0, ±1, and ±2 pseudo-transitions without parity change in the ground state. Shown are two R-branch transitions with ΔJ = −1. |
| In the text | |
|
Fig. 12 Radial velocity versus epoch for the VLSR ~ 45 km s-1 component with the data from Table 1. The dashed line provides an approximate drift, based on the average velocity obtained in November 1995 and in April 2012. For the latter epoch, the high velocity feature (VLSR = 49.9 km s-1) in the (7, 7) line (Fig. 2) was considered as an outlier and was not part of the average. |
| In the text | |
Current usage metrics show cumulative count of Article Views (full-text article views including HTML views, PDF and ePub downloads, according to the available data) and Abstracts Views on Vision4Press platform.
Data correspond to usage on the plateform after 2015. The current usage metrics is available 48-96 hours after online publication and is updated daily on week days.
Initial download of the metrics may take a while.