Fig. 9
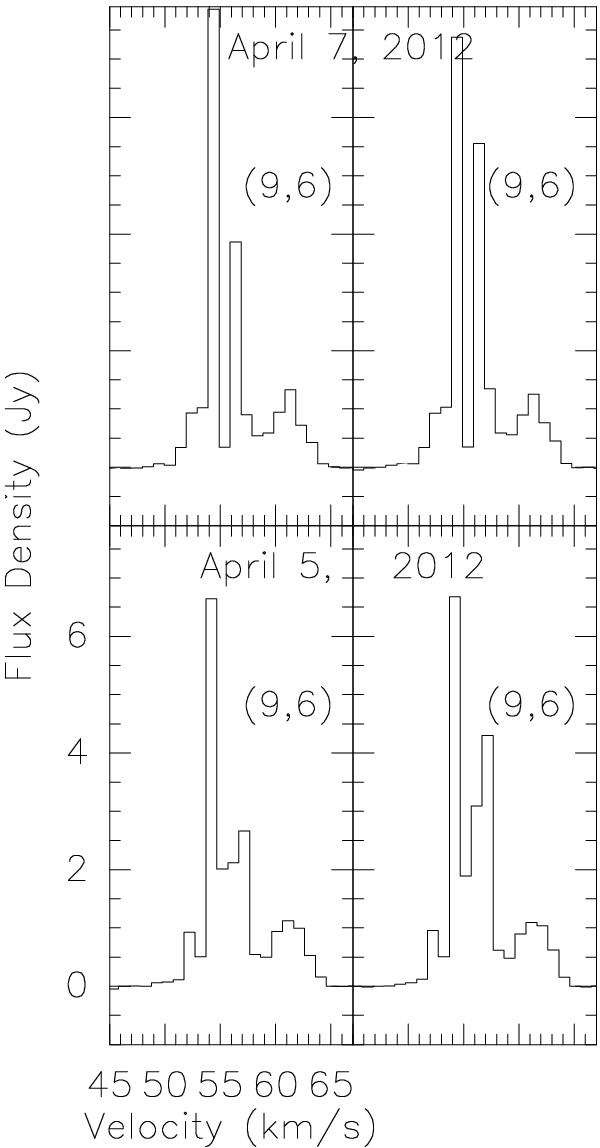
Linear polarisation in the 57 km s-1 component of the (9, 6) maser line on April 5 and 7, 2012. Shown are the two orthogonal components. The left panels display the horizontal (approximately east-west) and the right panels the vertical (approximately north-south) component, because the line was observed close to transit. Since the line is strong, the difference is highly significant and is visible in each of the 20 (April 5) and 60 (April 7) individual subscans. For beam size and channel spacing, see Table 1.
Current usage metrics show cumulative count of Article Views (full-text article views including HTML views, PDF and ePub downloads, according to the available data) and Abstracts Views on Vision4Press platform.
Data correspond to usage on the plateform after 2015. The current usage metrics is available 48-96 hours after online publication and is updated daily on week days.
Initial download of the metrics may take a while.