Free Access
Fig. 2
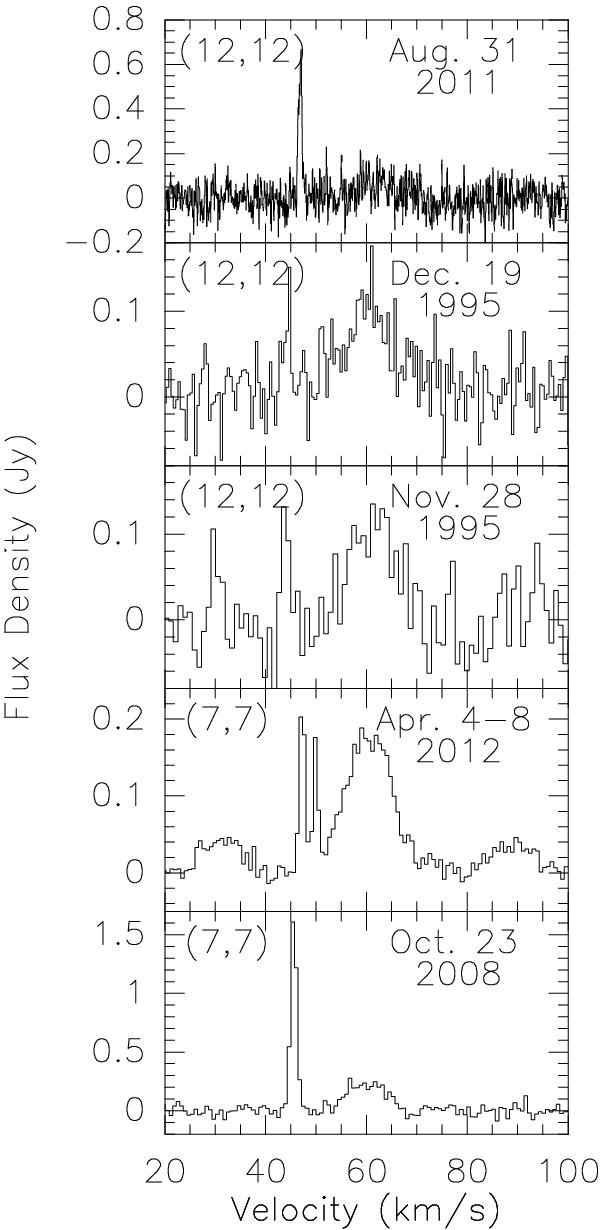
More NH3 spectra showing the new 45 km s-1 component (see also the caption to Fig. 1). In the second lowest panel, the features near 30 and 90 km s-1 are quasi-thermally excited satellite lines of the (7, 7) transition, caused by hyperfine splitting.
Current usage metrics show cumulative count of Article Views (full-text article views including HTML views, PDF and ePub downloads, according to the available data) and Abstracts Views on Vision4Press platform.
Data correspond to usage on the plateform after 2015. The current usage metrics is available 48-96 hours after online publication and is updated daily on week days.
Initial download of the metrics may take a while.