| Issue |
A&A
Volume 549, January 2013
|
|
|---|---|---|
| Article Number | A112 | |
| Number of page(s) | 9 | |
| Section | Interstellar and circumstellar matter | |
| DOI | https://doi.org/10.1051/0004-6361/201219522 | |
| Published online | 08 January 2013 | |
Why circumstellar disks are so faint in scattered light: the case of HD 100546
1
Astronomical Institute “Anton Pannekoek”, University of
Amsterdam, PO Box
94249, 1090 GE
Amsterdam, The
Netherlands
e-mail: mulders@uva.nl
2
SRON Netherlands Institute for Space Research,
PO Box 800, 9700 AV
Groningen, The
Netherlands
3
Department of Astrophysics/IMAPP, Radboud University
Nijmegen, PO Box
9010
6500 GL
Nijmegen, The
Netherlands
4
Space Telescope Science Institute, Baltimore, MD
21218,
USA
5
Steward Observatory, The University of Arizona,
933 North Cherry Avenue,
Tucson, AZ
85721,
USA
Received: 2 May 2012
Accepted: 19 November 2012
Context. Scattered light images of circumstellar disks play an important role in characterizing the planet forming environments around young stars. The characteristic size of the scattering dust grains can be estimated from the observed brightness asymmetry between the near and far side of the disk, for example using standard Mie theory. Such models, however, often overpredict the brightness of the disk by one or two orders of magnitude, and have difficulty explaining very red disk colors.
Aims. We aim to develop a dust model that simultaneously explains the observed disk surface brightness, colors, and asymmetry in scattered light, focusing on constraining grain sizes.
Methods. We use the 2D radiative transfer code MCMax with anisotropic scattering to explore the effects of grain size on synthetic scattered light images of circumstellar disks. We compare the results with surface brightness profiles of the protoplanetary disk HD 100546 in scattered light at wavelengths from 0.4 to 2.2 microns.
Results. We find that extreme forward scattering by micron-sized particles lowers the effective dust albedo and creates a faint, red disk that appears only slightly forward scattering. For the outer (≳100 AU) disk of HD 100546 we derive a minimum grain size of 2.5 microns, likely present in the form of aggregates. Intermediate-sized grains are too bright, whereas smaller grains are faint and scatter more isotropically, but also produce disk colors that are too blue.
Conclusions. Observed surface brightness asymmetries alone are not sufficient to constrain the grain size in circumstellar disks. Additional information, such as the brightness and colors of the disk, are needed to provide additional constraints.
Key words: scattering / radiative transfer / circumstellar matter / stars: individual: HD 100546 / protoplanetary disks
© ESO, 2013
1. Introduction
Protoplanetary disks are thought to be the main sites of planet formation, and spatially resolved scattered light images play an important role in revealing what happens before and during the birth of planetary systems. With superior diffraction-limited resolution compared to thermal emission at longer wavelengths, scattered light images in general, and those from the Hubble Space Telescope (HST) in particular, have provided us with some of the most detailed images of protoplanetary disks so far (e.g. Grady et al. 2001). Recent advances in adaptive optics and data reduction techniques have greatly improved the efficacy of ground-based data (e.g. Thalmann et al. 2010; Hashimoto et al. 2011; Quanz et al. 2011), while future observatories such as ALMA will achieve similar spatial resolution at (sub)millimeter wavelengths.
 |
Fig. 1 Visualization of anisotropic scattering properties of different dust species. Displayed are: a small particle in the Rayleigh limit (2πa < λ) in blue, an intermediate-sized particle (2πa ~ λ) in gray, and a large particle (2πa > λ) in red. The angle between the disk surface and incident stellar light is 3 degrees, equal to the flaring angle minus aspect ratio of the surface at 200 AU. The phase functions at 0.6 μm are plotted in polar coordinates, and normalized such that surfaces are equal (square root of intensity). The arrows indicate the direction and magnitude of light scattered towards the observer. |
Scattered light images offer important information on the overall geometry of protoplanetary disks and contain possible signposts of planets. Large scale spiral structures have been observed, some triggered by a close encounter from outside (Clampin et al. 2003; Quillen et al. 2005), others more likely by a (planetary) perturber from within (e.g. Grady et al. 2001). Annular gaps and inner holes are also observed, and are likely carved out by orbiting protoplanets (Grady et al. 2007; Thalmann et al. 2010; Hashimoto et al. 2011).
Apart from the macroscopic signposts at the end of the (giant) planet formation process, scattered light imaging can also shed light on the earliest stages of planet formation: the growth of dust grains. The main diagnostics for this are:
-
1.
Brightness asymmetries between the near and far side of the disk. In an inclined disk, the near and far side of the disk surface are seen under a different angle with respect to the star. If the dust scatters anisotropically, a brightness asymmetry is observed. Larger dust grains are more forward scattering, and will show a stronger brightness asymmetry. The observed values for the asymmetry parameter g in different disks are between ~0.15 (Ardila et al. 2007) and ~0.8 (Pinte et al. 2008b), ranging from nearly isotropic to slightly forward scattering.
-
2.
Disk surface brightness or dust albedo. The fraction of scattered light at a specific wavelength. In general, disks are observed to be much fainter than predicted on the basis of their grain size. A sample of Herbig stars imaged by Fukagawa et al. (2010) shows fractional luminosities in scattered light of a few percent or less. This is much too low for non-Rayleigh scattering particles, which typically have an albedo of ~0.5 or higher. In debris disks, which are optically thin, albedos on the order of 0.05 to 0.1 are derived from observations (Kalas et al. 2005; Krist et al. 2010; Golimowski et al. 2011), while an albedo of 0.5 is predicted on the basis of the grain radius of ~1 μm derived from asymmetries in the disk images.
-
3.
Disk color, caused by the wavelength dependence of the albedo. Dust grains in the interstellar medium have a gray scattering color at optical to near-infrared wavelengths (e.g. Whitney 1995), whereas more evolved objects such as debris disks (e.g. Golimowski et al. 2006; Debes et al. 2008), comets (Jewitt & Meech 1986), and Kuiper Belt objects (e.g. Luu & Jewitt 1996) can have redder colors, indicating that larger than ISM grains are present (e.g. Wolf et al. 2012). Most protoplanetary disks have gray colors (e.g. Fukagawa et al. 2010), though some disks exhibit redder colors: HD 141569 (Clampin et al. 2003), GG Tau (Krist et al. 2005), and HD 100546 (Ardila et al. 2007).
To solve this problem, we have studied the effects of anisotropic scattering on the observed brightness and colors. Particles that are large enough become extremely forward scattering. The bulk of the scattered light is concentrated in the forward peak, which is outside the range of observed angles for a disk that is not observed edge-on (Fig. 1). The resulting few percent are scattered towards the observer, resulting in a low “effective” albedo (Dullemond & Natta 2003). Because the observer of an inclined disk sees only a part of the phase function outside of the forward scattering peak, the disk image does not appear to have a strong brightness asymmetry, and can even appear backward scattering (Min et al. 2010). We describe this effect in more detail in Sect. 2.
We applied this strong forward-scattering dust model to the well-studied protoplanetary disk of HD 100546, for which scattered light images are available from 0.4 to 1.6 μm (Augereau et al. 2001; Ardila et al. 2007), and we present a new image at 2.22 μm in Sect. 3.1. After constructing a geometric model of the disk (Sect. 3.3), we derive the grain size from the observations (Sects. 3.4 and 3.5). We also discuss how the derived grain size compares to those of other size indicators (Sect. 4).
2. Scattering by protoplanetary dust
In this section we briefly discuss the basis of the scattering properties of protoplanetary dust (Mie 1908; Van der Hulst 1957; Bohren & Huffman 1983) and its influence on the observed brightness and color of scattered light images.
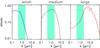 |
Fig. 2 Real versus effective albedo of particles of different sizes. The effective albedo (solid line) is defined here as the fraction of light scattered outside the forward ten degrees times the real albedo, see text (dotted line). The green area denotes the range of wavelengths covered by the HST scattered light images. The small, medium, and large panels correspond to a particle size of 0.08 μm, 0.25 μm, and 2.5 μm. |
2.1. Single scattering albedo
The fraction of light that is scattered by a dust grain in all directions is given by the single scattering albedo, ω. For particles much smaller than the wavelength of incident radiation, the albedo is very low since most light is absorbed by the particle. When the size of the particle increases, the single scattering albedo also increases. For particles much larger than this wavelength, the total extinction cross section of the particle includes three components: absorption (Cabs), reflection/refraction (Cref), and diffraction (Cdiff).
The absorption and reflection/refraction cross sections come directly from geometrical optics and are equal to to the geometrical shadow of the particle. The diffraction cross section comes from the distortion of the wavefront caused by the particle and is also equal to the geometrical shadow of the particle. It is then directly derived that the single scattering albedo of large particles is 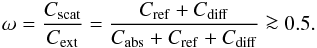 (1)
(1)
2.2. The effective albedo and the color of scattered light
The single scattering albedo is an angle-integrated quantity, and care should be taken when scattering becomes increasingly anisotropic. In the limit of Rayleigh scattering – where particles are much smaller than the observed wavelength – the phase function (F11(θ)) of scattering is close to isotropic (Fig. 3). For particles larger than the wavelength, the scattering becomes anisotropic and heavily peaked towards the forward direction when the particle size increases.
Light which is scattered in the forward direction by a particle in the surface layer of the disk is scattered into the disk, and will not be detected in scattered light images (see Fig. 1, large particle). Therefore, it is clear that for particles that scatter predominantly in the forward direction the effective scattering cross section, i.e., the amount of light that is actually scattered into our line of sight, is much smaller than would be expected from the angle integrated single scattering albedo. We define an effective albedo which only considers the part of the phase function that can actually be observed between angles θ1 and θ2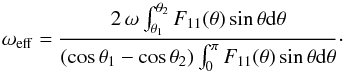 (2)For large particles this effective albedo can be less than 0.5 when the phase function is sufficiently peaked towards the forward scattering direction.
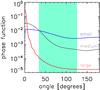 |
Fig. 3 Phase function of a large dust grain (2.5 μm, red line), an intermediate dust grain (0.25 μm, gray line), and a small dust grain (0.08 μm, blue line) at 0.6 μm. The green area marks the range of observed angles for HD 100546, between 34° and 126°. θ = 0° refers to forward scattering, and θ = 180° to backward scattering. |
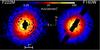 |
Fig. 4 PSF subtracted NICMOS images at 1.6 and 2.22 μm. The black region in the F160W image is masked out owing to a strong diffraction spike. |
In Fig. 2 we plot the effective and total albedo for three different grain sizes and for arbitrarily1θ1 = 10°,θ2 = 180°. For the small grains, the phase function is close to isotropic (see Fig. 3) and the effective and total albedo are almost the same. The color of scattered light for these grains is always gray to slightly blue.
The phase function of larger particles is more anisotropic, making the effective albedo quite low, even below the limit for the single scattering albedo (Eq. (1)). When going to longer wavelengths the phase function becomes more isotropic and the effective albedo increases. This increase of effective albedo with wavelength is reflected in the observed color of the scattered light images, producing reddish colors.
3. Application to HD 100546
To test if extreme forward scattering can explain the observed faintness of protoplanetary disks relative to their host stars (Fukagawa et al. 2010), and also explain their color indices and observed brightness asymmetries, we have compared our dust model to scattered light images of a well-studied Herbig star, HD 100546. Its disk has been imaged by the HST in scattered light over a broad wavelength range of 0.4 μm to 1.6 μm (Augereau et al. 2001; Ardila et al. 2007). We extend this wavelength range using a new NICMOS image at 2.2 μm. This wide range of wavelengths allows us to compare both brightness and colors. We describe these observations in the next section.
3.1. Observations
We took HST/NICMOS coronagraphic images (0.3′′ radius image plane obscuration, camera 2 image scale 75.8 mas/pixel) of HD 100546 and the point spread function (PSF) reference star, HD 109200 with the F222M filters (central λ = 2.22 μm, λ/Δλ ~ 10) on 16 March 2005 as part of Program GO 10167 (PI:Weinberger). The observations included long exposures with the stars underneath the coronagraphic spot for high contrast imaging at two different spacecraft orientations and direct images of both stars outside the coronagraphic hole with short exposures for point source photometry. The instrumentally calibrated and reduced images discussed in this paper were created from the raw NICMOS multiaccum exposures following the processing methodology described by Sect. 3 of Schneider et al. (2005) and the references therein.
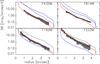 |
Fig. 5 Radial surface brightness profiles of scattered light images of HD 100546 (diamonds, gray area indicates systematic and measurement errors) and disk models with: a large dust grain (2.5 μm, red line), intermediate dust grain (0.25 μm, gray line), and small dust grain (0.075 μm, blue line). |
For photometric analysis, each calibrated direct image was used to independently determine the total photometry of the star and empirically determine the uncertainties in each filter band. The three images for each star and in each filter were located at different positions on the detector.
We used a median combination of the three dither points to create a final image of each star to derive a ratio for scaling and for photometry of HD 100546. We used a 20 pixel radius circular aperture to determine the photometry. The background in the images is zero, so no background annulus was used. The individual dither points were used to get a rough estimate of the uncertainty in the ratios and photometry. At F222M we measured a total Fν = 5.4 ± 0.1 Jy, and a scaling with the PSF reference of 0.89 ± 0.04.
To determine the best subtraction we minimized a chi-squared metric on a region of the target image dominated by the star’s diffraction spikes. We assumed that good subtraction of the diffraction spikes in a region uncontaminated by the disk corresponded to the best subtraction of the PSF within the region of interest (Schneider et al. 2001). We iteratively created subtractions for combinations of scaling and pixel offsets until we found an image that produced the lowest chi-squared measure. We searched within ±1 pixel to find the best x and y pixel offsets.
To quantify the systematic effects on the photometry, we repeated the subtractions varying the PSF scalings and offsets by ± 1σ from the minimum chi-square solution found above. Using an elliptical photometric aperture matched to the estimated inclination of the disk and that extended from between 0 5 to 4′′, we found the standard deviation in the disk flux densities from this suite of subtractions. In F160W and F222M, the total measured flux of the disk at both spacecraft orientations matched to within the uncertainties. We then propagated this systematic uncertainty into the total uncertainty in the flux density of the disk per pixel. Subtracted images were then geometrically corrected for the slight optical distortion of the NICMOS camera 2 at the coronagraphic focus. We used the x-direction pixel scale of 007595/pixel and the y-direction pixel scale of 007542/pixel to create an image with pixels that have the y-direction plate scale in both directions. The geometrically corrected images were rotated about the position of the occulted star to a common celestial orientation using the rotation centers given by the flight software in the raw data file headers. The final result is show in Fig. 4.
Additional observations of HD 100546 with NICMOS were performed as a part of the GO program 9295 (Augereau et al. 2001). Observations with NICMOS in the F160W filter were recovered from the archive, reduced in the same manner as the medium bandwidth images, and median combined. Archival PSF reference stars for the images were subtracted from the target observations. The F160W reference was HD 106797 as used in Augereau et al. (2001), but we followed the above procedure for subtraction as with the F222M filter. Figure 4 shows the resulting PSF subtracted NICMOS images of the HD 100546 disk used in this work.
HD 100546 was also observed with the HRC coronagraph on ACS in the F435W and F814W filters (Ardila et al. 2007). The final reduced images were kindly provided to us by D. Ardila. For the ACS observations, no independent estimate on the uncertainties in flux scaling for the disks was performed. We assumed that for both instruments this effect was ~5%, comparable to what we calculated for our medium bandwidth filter observations.
3.2. Surface brightness profile and disk albedo
The surface brightness profiles at 0.4, 0.8, 1.6, and 2.2 μm are shown in Fig. 5. They were constructed by taking the median surface brightness over an elliptical annulus whose shape corresponds2 to a disk at a position angle of 145° and inclined at 46°, the average inclination inferred by Pantin et al. (2000) and Ardila et al. (2007). To compare the surface brightness profiles of images taken at different spatial resolution, the width of the annuli is taken to be 0.15′′, which is the diffraction limit of the longest wavelength filter. For the uncertainties, we used local estimates at the major and minor axes of the standard deviation of counts within smaller apertures. Missing data were treated as NAN values and were not included in the median.
To measure the reflectivity of the disk observed in each filter, we define a geometric albedo ωdiskfor the disk, which is the fraction of (star)light scattered towards the observer at a specific radius r. It is defined as 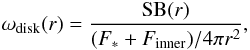 (3)where SB(r) is the surface brightness of the disk in scattered light, F∗ the flux density from the star, and Finner is the flux density from the inner (≲1 AU) disk3, both measured from the unresolved spectral energy distribution (SED). Note that this “disk albedo” ωdisk depends on both the dust albedo and the geometry of the disk (i.e., its flaring angle).
To quickly compare disk albedos at different wavelengths for both the data and the models, we define a geometric albedo per filter ωfilt at a typical radius of 2″. We obtain ωfilt by fitting a power law of the form ωfilt·(r)−q to ωdisk(r) between 1.0′′ and 3.5′′. When plotting this disk albedo versus the wavelength of the filter (Fig. 6), we obtain a diagnostic tool that describes the disk’s geometric albedo and colors. Throughout this paper, we apply this same procedure to the synthetic model images as well. These fitting parameters are displayed in Table 1.
As can be seen in Fig. 6, the disk is relatively faint compared to the star and has red colors over the entire wavelength range. Even though HD 100546 is one of the brightest disks to be observed in terms of absolute flux, it reflects only about one percent of the incoming light in the near infrared, and a factor of four less in the bluest filter. Any dust model invoked to explain scattered light images must be able to explain both this relative faintness and the red colors; however, as mentioned before, the geometric albedo is a product of both dust properties and disk geometry. This makes a geometric model of the disk necessary to isolate the effect of the dust albedo.
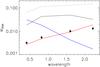 |
Fig. 6 Geometric albedo ωdisk of HD 100546 in the different filters. The geometric albedo is a measure of the fraction of light scattered by the disk (see Eq. (3)) and text for definition). Displayed are both observations (diamonds with systematic and measurement errors) and the same models as Fig. 5: A large, intermediate and small grain (red, gray, and blue solid line respectively). A model with intermediate-sized grains with an albedo close to one is also displayed (gray dotted line). |
3.3. Disk model
To interpret the scattered light images of HD 100546, we use the 2D radiative transfer code4 MCMax (Min et al. 2009) with anisotropic scattering for the dust as described in Sect. 2. This code has been successfully applied for modeling several observables of protoplanetary disks (e.g. Verhoeff et al. 2011) and includes anisotropic scattering (Min et al. 2012).
We do not have to start from scratch when constructing the disk model, as the disk geometry for HD 100546 is already well constrained by previous observations and models. We use the SED fit presented by Mulders et al. (2011) as a starting point for our model. The model features a depleted inner disk starting at 0.25 AU (Benisty et al. 2010; Tatulli et al. 2011) which is fairly small (<1 AU, Panić et al. 2012), has a large empty gap (Bouwman et al. 2003) and a massive outer disk starting from 13 AU to 400 AU (Grady et al. 2007; Panić et al. 2010).
The vertical density structure of the disk is described by a Gaussian ( ), where the fitted scale height is parametrized as Hp = 0.04 AU (r/AU)1.3, consistent with Mulders et al. (2011). We did not solve for the vertical hydrostatic structure because we want to study the effect of the dust properties in a fixed geometry, whereas in a hydrostatic disk the geometry changes with dust properties through the temperature. For this purpose it is therefore easier to use the prescribed vertical structure based on the hydrostatic model, which provides an equally good fit to the SED (Fig. 8).
Disk parameters for the geometrical model.
Dust properties of our best-fit model.
The inner disk (≲1 AU) is not directly probed by our images, but its thermal emission is a few times brighter than the star in the near-infrared. Light scattered off the outer disk surface in the longest filters is therefore dominated by scattered inner disk light, rather than scattered starlight (Pinte et al. 2008a). We take the dust composition from Mulders et al. (2011) for the inner disk (Table 3), and keep this composition fixed if we vary the composition of the outer disk, such that the light illuminating the outer disk remains constant. A first comparison with the observed scattered light images shows that using the same composition for the outer disk does not work well. It overpredicts the scattered light flux by a factor of 10 to 30 (see Fig. 6 gray dotted line).
However, the albedo of this dust is very high, close to one. We first explore the effects of lowering the albedo through the dust composition to reach a lower surface brightness. We switch to a different composition which has a particularly low albedo of ~0.5. This is also the theoretical limit in the geometrical optics regime (see Sect. 2) and in practice, a lower real albedo can only be achieved by changing particle size (see Fig. 2), which we do in the next section. For an albedo of 0.5 we use a dust composition derived from a condensation sequence, as described in Min et al. (2011). This lower albedo reduces the amount of scattered light significantly, but still overpredicts the observations by an order of magnitude (Fig. 6, dotted line). The final parameter we have to tune to obtain the low observed surface brightness is the grain size, which we discuss in the next two sections.
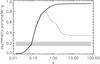 |
Fig. 7 Asymmetry parameter g as a function of particle size at 0.6 μm, calculated in two different ways. The solid line uses the formal definition g ≡ ⟨ cos θ ⟩ , the dotted line is a Henyey-Greenstein function fitted to the phase function in the observed range of scattering angles. The observed range of values of the asymmetry parameter is indicated by the gray area. |
3.4. Brightness asymmetry
To constrain the characteristic grain size in HD 100546 we look first at the observed brightness asymmetry of the disk. As already explained in Sect. 2, particles smaller than the wavelength of light (2πav < λ) scatter isotropically, whereas large particles become increasingly anisotropic. This anisotropy can be described by the asymmetry parameter g, which is the expectation value of the cosine of the scattering angle (g ≡ ⟨ cosθ ⟩ ), a parameter between 0 and 1 that increases with grain size (Fig. 7).
In reality, we can sample only a limited part of the phase function (34 to 126 degrees in HD 100546, for a 46° inclination and a 10° opening angle), and g cannot be calculated directly. The phase function is, therefore, often approximated by a Henyey-Greenstein function IHG(gHG,θ) (Henyey & Greenstein 1941), which is parametrized in such a way that the expectation value of the cosine of the scattering angle is equal to gHG. In this way the asymmetry parameter can be derived with only partial knowledge of the phase function. Care must be taken, however, by deriving grain sizes in this way. When grains become extremely forward scattering (g ≳ 0.5), the forward peak of the phase function caused by diffraction moves out of the observed range of angles (see Sect. 2, Min et al. 2010). The observed range caused by reflection/refraction is not necessarily forward peaked (Fig. 3), and the derived value of the asymmetry parameter gHG can become much smaller than the real asymmetry parameter g (see Fig. 7).
The disk of HD 100546 shows only a small brightness asymmetry of gHG = 0.15 between 0.4 and 0.8 μm, with maxima up to gHG = 0.23 (Ardila et al. 2007). Comparing this number to the real brightness asymmetry g yields a grain size of a ~ 0.08 μm, similar to a = 0.1 μm derived by Pantin et al. (2000) based on gHG = 0.2. By taking into account the limited part of the phase function observed, however, yields a second set of solutions with grain sizes larger than one micron which come close to the observed asymmetry (see Fig. 7).
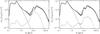 |
Fig. 8 Observed SED of HD 100546 plus photosphere (gray lines). The solid lines are two model SEDs with our best-fit aggregate in the entire outer disk (left) and with aggregates outside of 20 AU (right). The dotted and dashed lines denote the contributions to the SED of scattered light and thermal emission, respectively. |
3.5. Disk color and brightness
Although small particles (a = 0.08 μm) provide a good fit to the observed brightness asymmetries, they can not explain the disk color. They scatter in the Rayleigh limit (2πa < λ), and hence the scattering efficiency drops off as λ-4. Such an albedo, that decreases with wavelength (Fig. 2), will give rise to very blue disk colors, and it becomes clear that these small particles might explain a low albedo at one wavelength, but never the observed disk colors (Fig. 6, blue line). As discussed before, intermediate-sized particles (2πa ~ λ) have a high albedo ≳0.5 and overpredict the disk brightness (Fig. 6, gray line) and also appear too forward scattering (Fig. 7).
Larger particles (2πav > λ), on the other hand, do a much better job of explaining the disk colors and brightness. As described in Sect. 2 and shown in Fig. 2, forward scattering decreases the effective albedo towards shorter wavelengths, though the real albedo stays above the theoretical minimum of 0.5 (Eq. (1)). A particle of 2.5 μm fits both the colors and brightness of the disk (Figs. 5 and 6, red lines), though its brightness asymmetry is a little too high. We discuss this further in Sect. 4.3. A particle with a different composition that has a higher real albedo would need to be larger to reduce its effective albedo to the same level. For example, a particle of different composition that has a real albedo of 1.0 needs to have a size of 10 μm to explain the observed brightness.
4. Discussion
We have shown that particles larger than 2.5 microns can explain the red colors and low brightness in the disk of HD 100546. The question arises whether such large grains are consistent with other grain size indicators in the SED, and why we overpredict the brightness asymmetry, which we discuss in the next sections.
4.1. The ten-micron silicate feature
One grain size indicator in the SED is the silicate feature at 10 μm, which indicates the presence of micron-sized grains or smaller. At a wavelength of 10 μm, however, particles larger than 2.5 μm scatter extremely efficiently because they are in the resonance regime (2πa ~ 10 μm). In addition, for particles this large compared to the wavelength of 10 μm, the absorption and scattering coefficients add up to the geometrical shadow of the particle, as is the case for particles in the limit of geometrical optics (Sect. 2). Hence the silicate feature is imprinted inversely on the scattering efficiency at this wavelength (Min et al. 2004). The combination of both effects suppresses the silicate feature (Fig. 8).
It should be noted that the silicate feature arises mainly in the disk wall (Bouwman et al. 2003), whereas the scattered light images trace a region outwards of 0.5′′ (~50 AU at a distance of 103 pc). Radial variations in the dust properties have been observed in scattered light (e.g. Quanz et al. 2011; Debes et al., in prep.), and the mineralogy and chemistry in the disk wall are also different from the outer disk (Thi et al. 2011; Mulders et al. 2011). A model where the region <20 AU is dominated by small grains (>50%), and the outer disk by large grains (>99.9%) provides a good fit to both scattered light images and SED (Fig. 8).
It is interesting to see that this model agrees qualitatively well with the model presented in Benisty et al. (2010) and Tatulli et al. (2011): a disk wall dominated by small grains that produce the silicate feature, and larger grains farther out. This result appears not to be in agreement with the polarimetry results from Quanz et al. (2011), who do find a change in dust grain properties around 50 to 100 AU, but with small grains farther out and bigger grains inwards. However, it should be noted that this conclusion is based mainly on brightness asymmetry, which, as we have shown, might be ambiguous in deriving grain sizes.
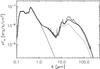 |
Fig. 9 Observed SED of HD 100546 plus photosphere (gray lines). Also displayed are a series of models with self-consistent dust settling with a turbulent mixing strength of α = 0.01, for grains with surface-to-mass ratios of σ/m = 105 cm2/g (solid line) and 4 × 103 cm2/g (dotted line), corresponding to compact grains of 0.1 and 2.5 μm, respectively. |
4.2. Dust settling
Apart from the presence of millimeter-sized grains (Bouwman et al. 2003; Benisty et al. 2010), which are most likely located near the disk midplane, the SED of HD 100546 with its strong mid- and far-infrared excess does not show strong signs of dust settling. A population of small grains in a hydrostatic disk can explain the SED (Dominik et al. 2003; Mulders et al. 2011), showing that dust and gas must be well-mixed. In this section we discuss how such large grains can be present at the disk surface.
To find the maximum grain size that can be present at the disk surface, we ran a series of models that use self-consistent settling as described in Mulders & Dominik (2012). The dust-gas coupling in this model depends on the dust-to-gas ratio (dtg), turbulent mixing strength αturb, and dust grain surface-to-mass ratio (σ/m). For plausible values of these parameters (dtg = 0.01, αturb = 0.01), we find that in a disk that has 0.005 M⊙ of gas, a minimum surface-to-mass ratio of 105 cm2/g is required to keep particles present at the disk surface (Fig. 9). This corresponds to a 0.1 μm compact particle. To keep particles larger than 2.5 μm present at the disk surface would require a stronger coupling of dust and gas. We can think of three ways to achieve this:
-
1.
A turbulent mixing strength higher than αturb = 0.2. Although such a high α could be present in the upper layers of the disk (e.g. Fromang & Nelson 2009), it would make HD 100546 a special case among Herbig stars which have on average a much lower mixing strength (Mulders & Dominik 2012), and it is beyond the scope of this paper to explore this further.
-
2.
A gas mass higher than 0.1 M⊙. Although such a mass is not unreasonable for a 2.4 M⊙ Herbig star (e.g. Williams & Cieza 2011), observations of gas emission lines point towards a lower rather than a higher gas mass, with a total mass in the range between 0.0005 and 0.01 M⊙ (Panić et al. 2010; Thi et al. 2011).
-
3.
Porous grains. A more porous grain has a higher surface-to-mass ratio than a compact particle, resulting in a stronger dust-gas coupling. Keeping the dust mass fixed, the surface-to-mass ratio of an aggregate scales with filling factor ff as
 (4)because
the radius scales as a = ff−1/3. For an
increase of a factor of ≳25 in the surface-to-mass ratio, this gives a filling
factor of ff ≲ 0.01, a very fluffy aggregate.
(4)because
the radius scales as a = ff−1/3. For an
increase of a factor of ≳25 in the surface-to-mass ratio, this gives a filling
factor of ff ≲ 0.01, a very fluffy aggregate.
4.3. Phase function at intermediate scattering angles
The scattering properties of complex aggregates are less well known than those of compact spheres. The general scattering behavior is expected to be similar for different particle structure – i.e., a strong forward scattering peak due to diffraction and a red color of the effective albedo – while the detailed behavior of light scattering at intermediate angles is less well established: the phase function for reflection/refraction is less well known and can be forward or backward scattering depending on the shape and structure of the particles (Min et al. 2010). Since the phase function can only be derived from observations at intermediate angles, fitting the brightness asymmetry requires including the aggregate structure.
Full discrete dipole approximation calculations are required to determine aggregate scattering properties. These calculations are computationally expensive, which makes them impractical to use directly in radiative transfer codes. The beginnings of a different theory based on effective medium theory are there (Min et al. 2006), reducing computing time for aggregate opacities; however, effective medium theory has a big limitation. The main assumption is that the constituents are much smaller than the wavelength of incident radiation. This implies that the scattering efficiency of the constituents in this approximation is zero. We believe that in reality the constituents of the aggregates are approximately a micron in size, which makes the scattering properties of individual monomers an important aspect for computing the phase function of the aggregate at intermediate scattering angles. Therefore their scattering properties need to be tested before they can be applied directly to scattered light images in the way we have done in this paper.
5. Conclusion
We studied the effects of grain size on the colors, surface brightness and brightness asymmetry of scattered light images of circumstellar disks. We used a 2D radiative transfer code that includes anisotropic scattering to model the disk of HD 100546 over a broad wavelength range (0.4 to 2.2 μm). Our conclusions are:
-
The low observed albedos of circumstellar dust can be explained by extreme forward scattering on grains larger than the observing wavelength. This reduces the effective albedo below the practical lower limit of 0.5 for the real albedo, and produces gray to red disk colors. Small grains also have low albedos, but with very blue colors.
-
The brightness asymmetry between the near and far side of a circumstellar disk is not a unique indicator of grain size. For large grains, the forward scattering peak in the phase function is not observed, while the phase function in the observed range of angles can appear more isotropic. This mimics the brightness asymmetry of small grains, but with a lower albedo.
-
The red colors, low albedo, and small brightness asymmetry of the protoplanetary disk around HD 100546 can be explained by a grain size larger than 2.5 to 10 microns, depending on composition and particle structure. The presence of such large particles at the outer disk surface indicates they must be present in the form of porous aggregates, rather than compact particles.
Acknowledgments
This research project is financially supported by a joint grant from the Netherlands Research School for Astronomy (NOVA) and the Netherlands Institute for Space Research (SRON). The research is based on observations made with the NASA/ESA Hubble Space Telescope, obtained at the Space Telescope Science Institute (STScI), which is operated by the Association of Universities for Research in Astronomy (AURA), Inc., under NASA contract NAS5-26555. These observations are associated with program #s 10167, 9295, and 9987. Support for program # 10167 was provided by NASA through a grant from STScI.
References
- Ardila, D. R., Golimowski, D. A., Krist, J. E., et al. 2007, ApJ, 665, 512 [NASA ADS] [CrossRef] [Google Scholar]
- Augereau, J.-C., Lagrange, A. M., Mouillet, D., & Menard, F. 2001, A&A, 365, 78 [NASA ADS] [CrossRef] [EDP Sciences] [Google Scholar]
- Begemann, B., Dorschner, J., Henning, T., Mutschke, H., & Thamm, E. 1994, ApJ, 423, L71 [NASA ADS] [CrossRef] [Google Scholar]
- Benisty, M., Tatulli, E., Menard, F., & Swain, M. R. 2010, A&A, 511, A75 [NASA ADS] [CrossRef] [EDP Sciences] [Google Scholar]
- Bohren, C. F., & Huffman, D. R. 1983, Absorption and scattering of light by small particles (New York: Wiley) [Google Scholar]
- Bouwman, J., de Koter, A., Dominik, C., & Waters, L. B. F. M. 2003, A&A, 401, 577 [NASA ADS] [CrossRef] [EDP Sciences] [Google Scholar]
- Clampin, M., Krist, J. E., Ardila, D. R., et al. 2003, AJ, 126, 385 [NASA ADS] [CrossRef] [Google Scholar]
- Debes, J. H., Weinberger, A. J., & Schneider, G. 2008, ApJ, 673, L191 [NASA ADS] [CrossRef] [Google Scholar]
- Dominik, C., Dullemond, C. P., Waters, L. B. F. M., & Walch, S. 2003, A&A, 398, 607 [NASA ADS] [CrossRef] [EDP Sciences] [Google Scholar]
- Dominik, C., Blum, J., Cuzzi, J. N., & Wurm, G. 2007, Protostars and Planets V, 783 [Google Scholar]
- Dorschner, J., Begemann, B., Henning, T., Jaeger, C., & Mutschke, H. 1995, A&A, 300, 503 [NASA ADS] [Google Scholar]
- Dullemond, C. P., & Natta, A. 2003, A&A, 408, 161 [NASA ADS] [CrossRef] [EDP Sciences] [Google Scholar]
- Fromang, S., & Nelson, R. P. 2009, A&A, 496, 597 [NASA ADS] [CrossRef] [EDP Sciences] [Google Scholar]
- Fukagawa, M., Tamura, M., Itoh, Y., et al. 2010, Publ. Astron. Soc. Jpn, 62, 347 [Google Scholar]
- Golimowski, D. A., Ardila, D. R., Krist, J. E., et al. 2006, AJ, 131, 3109 [NASA ADS] [CrossRef] [Google Scholar]
- Golimowski, D. A., Krist, J. E., Stapelfeldt, K. R., et al. 2011, AJ, 142, 30 [NASA ADS] [CrossRef] [Google Scholar]
- Grady, C. A., Polomski, E. F., Henning, T., et al. 2001, AJ, 122, 3396 [NASA ADS] [CrossRef] [Google Scholar]
- Grady, C. A., Schneider, G., Hamaguchi, K., et al. 2007, ApJ, 665, 1391 [NASA ADS] [CrossRef] [Google Scholar]
- Hashimoto, J., Tamura, M., Muto, T., et al. 2011, ApJ, 729, L17 [NASA ADS] [CrossRef] [Google Scholar]
- Henning, T., & Stognienko, R. 1996, A&A, 311, 291 [NASA ADS] [Google Scholar]
- Henyey, L. G., & Greenstein, J. L. 1941, ApJ, 93, 70 [NASA ADS] [CrossRef] [Google Scholar]
- Jewitt, D., & Meech, K. J. 1986, ApJ, 310, 937 [NASA ADS] [CrossRef] [Google Scholar]
- Kalas, P., Graham, J. R., & Clampin, M. 2005, Nature, 435, 1067 [NASA ADS] [CrossRef] [PubMed] [Google Scholar]
- Krist, J. E., Stapelfeldt, K. R., Golimowski, D. A., et al. 2005, AJ, 130, 2778 [NASA ADS] [CrossRef] [Google Scholar]
- Krist, J. E., Stapelfeldt, K. R., Bryden, G., et al. 2010, AJ, 140, 1051 [NASA ADS] [CrossRef] [Google Scholar]
- Luu, J., & Jewitt, D. 1996, AJ, 112, 2310 [NASA ADS] [CrossRef] [Google Scholar]
- Mie, G. 1908, Annalen der Physik, 330, 377 [Google Scholar]
- Min, M., Dominik, C., & Waters, L. B. F. M. 2004, A&A, 413, L35 [NASA ADS] [CrossRef] [EDP Sciences] [Google Scholar]
- Min, M., Dominik, C., Hovenier, J. W., de Koter, A., & Waters, L. B. F. M. 2006, A&A, 445, 1005 [NASA ADS] [CrossRef] [EDP Sciences] [MathSciNet] [Google Scholar]
- Min, M., Dullemond, C. P., Dominik, C., de Koter, A., & Hovenier, J. W. 2009, A&A, 497, 155 [NASA ADS] [CrossRef] [EDP Sciences] [Google Scholar]
- Min, M., Kama, M., Dominik, C., & Waters, L. B. F. M. 2010, A&A, 509, L6 [NASA ADS] [CrossRef] [EDP Sciences] [Google Scholar]
- Min, M., Dullemond, C. P., Kama, M., & Dominik, C. 2011, Icarus, 212, 416 [NASA ADS] [CrossRef] [Google Scholar]
- Min, M., Canovas, H., Mulders, G. D., & Keller, C. U. 2012, A&A, 537, A75 [NASA ADS] [CrossRef] [EDP Sciences] [Google Scholar]
- Mulders, G. D., & Dominik, C. 2012, A&A, 539, A9 [NASA ADS] [CrossRef] [EDP Sciences] [Google Scholar]
- Mulders, G. D., Waters, L. B. F. M., Dominik, C., et al. 2011, A&A, 531, A93 [NASA ADS] [CrossRef] [EDP Sciences] [Google Scholar]
- Mutschke, H., Begemann, B., Dorschner, J., et al. 1998, A&A, 333, 188 [NASA ADS] [Google Scholar]
- Ormel, C. W., Spaans, M., & Tielens, A. G. G. M. 2007, A&A, 461, 215 [NASA ADS] [CrossRef] [EDP Sciences] [Google Scholar]
- Panić, O., van Dishoeck, E. F., Hogerheijde, M. R., et al. 2010, A&A, 519, A110 [NASA ADS] [CrossRef] [EDP Sciences] [Google Scholar]
- Panić, O., Ratzka, T., Mulders, G. D., et al. 2012, A&A, submitted [arXiv:1203.6265] [Google Scholar]
- Pantin, E., Waelkens, C., & Lagage, P. O. 2000, A&A, 361, L9 [NASA ADS] [Google Scholar]
- Pinte, C., Menard, F., Berger, J. P., Benisty, M., & Malbet, F. 2008a, ApJ, 673, L63 [NASA ADS] [CrossRef] [Google Scholar]
- Pinte, C., Padgett, D. L., Menard, F., et al. 2008b, A&A, 489, 633 [NASA ADS] [CrossRef] [EDP Sciences] [Google Scholar]
- Preibisch, T., Ossenkopf, V., Yorke, H. W., & Henning, T. 1993, A&A, 279, 577 [NASA ADS] [Google Scholar]
- Quanz, S. P., Schmid, H. M., Geissler, K., et al. 2011, ApJ, 738, 23 [NASA ADS] [CrossRef] [Google Scholar]
- Quillen, A. C., Varnière, P., Minchev, I., & Frank, A. 2005, AJ, 129, 2481 [NASA ADS] [CrossRef] [Google Scholar]
- Schneider, G., Becklin, E. E., Smith, B. A., et al. 2001, AJ, 121, 525 [Google Scholar]
- Schneider, G., Silverstone, M. D., & Hines, D. C. 2005, ApJ, 629, L117 [NASA ADS] [CrossRef] [Google Scholar]
- Tatulli, E., Benisty, M., Menard, F., et al. 2011, A&A, 531, A1 [NASA ADS] [CrossRef] [EDP Sciences] [Google Scholar]
- Thalmann, C., Grady, C. A., Goto, M., et al. 2010, ApJ, 718, L87 [NASA ADS] [CrossRef] [Google Scholar]
- Thi, W. F., Menard, F., Meeus, G., et al. 2011, A&A, 530, L2 [NASA ADS] [CrossRef] [EDP Sciences] [Google Scholar]
- Van der Hulst, H. C. 1957, Light Scattering by Small Particles (New York: John Wiley & Sons, Inc.) [Google Scholar]
- Verhoeff, A. P., Min, M., Pantin, E., et al. 2011, A&A, 528, A91 [NASA ADS] [CrossRef] [EDP Sciences] [Google Scholar]
- Whitney, B. A. 1995, Rev. Mex. Astron. Astrofis. Ser. Conf., 1, 201 [NASA ADS] [Google Scholar]
- Williams, J. P., & Cieza, L. A. 2011, ARA&A, 49, 67 [NASA ADS] [CrossRef] [Google Scholar]
- Wolf, S., Malbet, F., Alexander, R., et al. 2012, A&ARv, 20, 52 [NASA ADS] [CrossRef] [Google Scholar]
- Wurm, G., & Blum, J. 1998, Icarus, 132, 125 [NASA ADS] [CrossRef] [Google Scholar]
- Zsom, A., & Dullemond, C. P. 2008, A&A, 489, 931 [NASA ADS] [CrossRef] [EDP Sciences] [Google Scholar]
All Tables
All Figures
|
Fig. 1 Visualization of anisotropic scattering properties of different dust species. Displayed are: a small particle in the Rayleigh limit (2πa < λ) in blue, an intermediate-sized particle (2πa ~ λ) in gray, and a large particle (2πa > λ) in red. The angle between the disk surface and incident stellar light is 3 degrees, equal to the flaring angle minus aspect ratio of the surface at 200 AU. The phase functions at 0.6 μm are plotted in polar coordinates, and normalized such that surfaces are equal (square root of intensity). The arrows indicate the direction and magnitude of light scattered towards the observer. |
| In the text | |
|
Fig. 2 Real versus effective albedo of particles of different sizes. The effective albedo (solid line) is defined here as the fraction of light scattered outside the forward ten degrees times the real albedo, see text (dotted line). The green area denotes the range of wavelengths covered by the HST scattered light images. The small, medium, and large panels correspond to a particle size of 0.08 μm, 0.25 μm, and 2.5 μm. |
| In the text | |
|
Fig. 3 Phase function of a large dust grain (2.5 μm, red line), an intermediate dust grain (0.25 μm, gray line), and a small dust grain (0.08 μm, blue line) at 0.6 μm. The green area marks the range of observed angles for HD 100546, between 34° and 126°. θ = 0° refers to forward scattering, and θ = 180° to backward scattering. |
| In the text | |
|
Fig. 4 PSF subtracted NICMOS images at 1.6 and 2.22 μm. The black region in the F160W image is masked out owing to a strong diffraction spike. |
| In the text | |
|
Fig. 5 Radial surface brightness profiles of scattered light images of HD 100546 (diamonds, gray area indicates systematic and measurement errors) and disk models with: a large dust grain (2.5 μm, red line), intermediate dust grain (0.25 μm, gray line), and small dust grain (0.075 μm, blue line). |
| In the text | |
|
Fig. 6 Geometric albedo ωdisk of HD 100546 in the different filters. The geometric albedo is a measure of the fraction of light scattered by the disk (see Eq. (3)) and text for definition). Displayed are both observations (diamonds with systematic and measurement errors) and the same models as Fig. 5: A large, intermediate and small grain (red, gray, and blue solid line respectively). A model with intermediate-sized grains with an albedo close to one is also displayed (gray dotted line). |
| In the text | |
|
Fig. 7 Asymmetry parameter g as a function of particle size at 0.6 μm, calculated in two different ways. The solid line uses the formal definition g ≡ ⟨ cos θ ⟩ , the dotted line is a Henyey-Greenstein function fitted to the phase function in the observed range of scattering angles. The observed range of values of the asymmetry parameter is indicated by the gray area. |
| In the text | |
|
Fig. 8 Observed SED of HD 100546 plus photosphere (gray lines). The solid lines are two model SEDs with our best-fit aggregate in the entire outer disk (left) and with aggregates outside of 20 AU (right). The dotted and dashed lines denote the contributions to the SED of scattered light and thermal emission, respectively. |
| In the text | |
|
Fig. 9 Observed SED of HD 100546 plus photosphere (gray lines). Also displayed are a series of models with self-consistent dust settling with a turbulent mixing strength of α = 0.01, for grains with surface-to-mass ratios of σ/m = 105 cm2/g (solid line) and 4 × 103 cm2/g (dotted line), corresponding to compact grains of 0.1 and 2.5 μm, respectively. |
| In the text | |
Current usage metrics show cumulative count of Article Views (full-text article views including HTML views, PDF and ePub downloads, according to the available data) and Abstracts Views on Vision4Press platform.
Data correspond to usage on the plateform after 2015. The current usage metrics is available 48-96 hours after online publication and is updated daily on week days.
Initial download of the metrics may take a while.