| Issue |
A&A
Volume 549, January 2013
|
|
|---|---|---|
| Article Number | A144 | |
| Number of page(s) | 6 | |
| Section | Extragalactic astronomy | |
| DOI | https://doi.org/10.1051/0004-6361/201219426 | |
| Published online | 15 January 2013 | |
Multi-band constraints on the nature of emission line galaxies
INAF – Osservatorio Astrofisico di Torino, via Osservatorio 20, 10025 Pino Torinese, Italy
e-mail: balmaverde@oato.inaf.it
Received: 17 April 2012
Accepted: 27 November 2012
Our aim is to explore the nature of emission line galaxies by combining high-resolution observations obtained in different bands to understand which objects are powered by an active galactic nucleus (AGN). From the spectroscopic Palomar survey of nearby bright galaxies, we selected a sample of 18 objects observed with Hubble Space Telescope (HST), Chandra, and Very Large Array (VLA). No connection is found between X-ray and emission line luminosities from ground-based data, unlike what is found for brighter AGN. Conversely, a strong correlation emerges when using the HST spectroscopic data, which are extracted on a much smaller aperture. This suggests that the HST data better isolate the AGN component when one is present, while ground-based line measurements are affected by diffuse emission from the host galaxies. The sample separates into two populations. The 11 objects belonging to the first class have an equivalent width (EW) of the [O III] emission line measured from HST data EW[O III] ≳ 2 Å and are associated with an X-ray nuclear source; in the second group we find seven galaxies with EW[O III] ≲ 1 Å that generally do not show any emission related to an active nucleus (emission lines, X-ray, or radio sources). This latter group includes about half of the low ionization nuclear emission-line region or transition galaxies of the sample, all of which are objects of low [O III] line luminosity (≲1038 erg s-1) and low equivalent width ( ≲ 1 Å) in ground-based observations. These results strengthen the suggestion that the EW[O III] value is a robust predictor of the nature of an emission line galaxy.
Key words: galaxies: active / galaxies: ISM / X-rays: galaxies / radio continuum: galaxies
© ESO, 2013
1. Introduction
Emission lines are among the most widely used tools to reveal an active galactic nucleus (AGN) and to explore its properties. The luminosity of narrow emission lines is a robust estimator of the AGN bolometric luminosity (Mulchaey et al. 1996) and emission line ratios can distinguish H II regions from gas ionized by nuclear activity (Heckman 1980) and separate AGN into various subclasses, e.g., Seyferts and low ionization nuclear emission-line regions (LINERs, Kewley et al. 2006).
However, the nature of emission line galaxies, and particularly of LINERs, is controversial, and it is still unclear which objects are indeed powered by an active nucleus and how they can be isolated from the overall population. We recently showed that the host galaxies produce a substantial contamination of the emission lines. In Capetti (2011) we considered the spectra of ~300 000 galaxies with z < 0.1 from the Sloan Digital Sky Survey (SDSS). We found that the equivalent width (EW) distribution of the [O III]λ5007 emission line, EW[O III]1, is strongly clustered around ~0.6 Å. The same conclusion was obtained from studying the 486 nearby (average distance of ~15 Mpc) bright galaxies from the Palomar survey (Filippenko & Sargent 1985; Ho et al. 1997). The bulk of these low EW objects is formed by LINERs, but they also include a significant number of galaxies classified as Seyfert, although located not far from the LINERs/Seyfert dividing line. These results are very difficult to account for if the emission lines are powered by an AGN because it requires a fine-tuning between the strength of the nuclear ionizing field, the spatial distribution of the emission lines, and the stellar mass. Conversely, the strong connection between line emission and stellar continuum points to a stellar origin of the emission lines. In particular, it has been suggested that hot evolved stars can play a dominant role (e.g., Trinchieri & di Serego Alighieri 1991; Binette et al. 1994), an idea also supported by the results obtained from photoionization models that are able to reproduce the observed EW and optical line ratios (e.g., Stasińska et al. 2008; Sarzi et al. 2010). These results cast doubts on the reliability of the identification of active galaxies based solely on optical spectroscopy, particularly those of LINERs of low line luminosity.
The signature of an active nucleus can also be sought in other observing bands such as in the X-ray and in high-resolution radio observations. Furthermore, because the dominant contamination of the emission lines is apparently associated with stellar processes, significant progress can be made by considering spectra obtained in a smaller physical region, such as those produced with Hubble Space Telescope (HST) observations.
Our aim is to use multiband data to obtain a better understanding of the nature of emission line galaxies, i.e., which of these objects is associated with an AGN, particularly at low luminosities. Several studies were already performed along this line (see, e.g., Nagar et al. 2005; Zhang et al. 2009; González-Martín et al. 2009). The element of novelty of our study is the inclusion of the [O III] equivalent width in the analysis, which, as explained above, is related to the effects of the contamination from the host galaxies to the emission lines. We show that as a result of this approach, a significant improvement in the classification of galaxies in the various classes of activity can be achieved once the proper set of observational data is available.
Parameters of the sample galaxies.
2. Sample and the multi-band data
The sample of 23 galaxies selected for the Survey of Nearby Nuclei with the Space Telescope Imaging Spectrograph (STIS) on board HST (SUNNS, Shields et al. 2004) is perfectly suited for our purposes. The SUNNS targets were drawn from the Palomar survey and include all galaxies within 17 Mpc with emission lines fluxes greater than 10-15 erg s-1 cm-2 within a 2″ × 4″ aperture. An archival search showed, in addition to the HST spectroscopic data, an almost complete coverage also of Chandra and Very Large Array (VLA) observations. The SUNNS galaxies offer a good representation of the various classes of activity (as derived from the Palomar survey) including LINERs, Seyfert, and transition galaxies (see Table 1). We provide in Table 1 both the original spectral classification from Ho et al. (1997) and that based on the scheme proposed by Kewley et al. (2006) into LINERs, Seyfert, and ambiguous galaxies2 derived from their location in the three diagnostic diagrams shown in Fig. 1. Because we are mainly interested in active galaxies, we will not consider the five star-forming galaxies part of the SUNNS sample. From the point of view of the line strengths, EW[O III] has a distribution similar to that of the whole Palomar sample (see Fig. 2). In particular, the concentration toward low EW values is still present, although reduced with respect to the whole sample. This is due to the selection only of objects of high emission line fluxes.
These objects have been observed with STIS through a 0 2 wide slit with two grisms (G430L and G750M) that covered the blue and red part of the optical spectrum with an exposure time of ~1800 and ~3000 s. Emission line measurements were obtained by Shields et al. (2007) from spectra extracted from a 02 × 025 synthetic aperture.
In the Chandra public archive we found data for all but one of the 18 selected SUNNS galaxies. Observations of most of them are already presented in the literature, but we preferred, for the sake of homogeneity, to re-analyze these data. For each object we extracted the spectrum in a region of 15 of radius, centered on the X-ray source closer to the peak of the optical emission as measured from HST imaging. The optical/X-ray offsets are all smaller than ~ 11, as expected from the accuracy of the relative astrometry between HST and Chandra images. Nevertheless, some sources are situated in a crowded field where the identification is uncertain (e.g., NGC 4321).
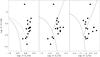 |
Fig. 1 Spectroscopic diagnostic diagrams for the 18 galaxies of the SUNNS sample. The solid lines are from Kewley et al. (2006) and separate star-forming galaxies, LINER, and Seyfert; in the first panel the region between the two curves is populated by the composite galaxies. |
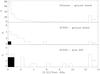 |
Fig. 2 EW[O III] distribution for the Palomar sample (top panel). The first bin contains 299 objects, including 96 emission galaxies whose [O III] line is not detected. In the other panels we show instead the EW[O III] distribution for the SUNNS subsample derived from the Palomar (middle) and the HST (bottom) observations. The filled areas indicate EW[O III] upper limits; the horizontal arrows show the objects with EW[O III] larger than 13 Å. |
We generally fit the data with a single power-law with the column density NH fixed at the Galactic value. In four cases, the observed counts are not sufficient to constrain the spectral index Γ and we fixed its value to 1.7. We explored the possible presence of additional local absorption, NH,z. The data quality is sufficient to test this effect in six galaxies but we do not find any convincing example (based on the F-test) of an absorbed source. The corresponding upper limits are in the range NH,z ~ 1−5 × 1021 cm-2. In two cases, the data instead show a preference for a more complex model that also includes thermal emission (i.e., NGC 4203 and NGC 4321).
When no clear point source was present, we estimated a 1σ upper limit, adopting the model described before and setting the power-law normalization to reproduce the observed count rate.
All these sources have high-resolution (~015) radio data available, that were obtained with the VLA at 15 GHz (Nagar et al. 2005); five of them are detected in the radio band (see Table 1).
3. Results
A strong correlation between the [O III] and the X-ray luminosity is known to exist for unobscured AGN, i.e., Type I Seyfert galaxies and quasars (e.g., Heckman et al. 2005; Panessa et al. 2006). This can be interpreted as due to the common origin from the accretion disk of the radiation field that photoionizes the surrounding gas and produces the line emission on the one hand, and of the hard X-ray emission of the disk corona on the other hand.
The SUNNS galaxies do not obey to this general trend (see Fig. 3, left panel). Only a weak link between L [O III] and LX is found and most objects lie well above the relation defined by the more powerful unobscured AGN. Several interpretations can be suggested, for instance that the spectral energy distribution of these low-luminosity AGN differ from that of their brighter counterparts, or, alternatively, that they are strongly absorbed in the X-ray. However, as reported in Sect. 2, in six galaxies we were able to test the presence of X-ray absorption, always with a negative result. Two of these sources (namely NGC 4203 and NGC 4450) show broad lines in their HST spectra but in the remaining four (NGC 2787, NGC 4143, NGC 4698, and NGC 5055) only narrow lines are seen. This result agrees with the finding that low-luminosity AGN (LX ≲ 1040 erg s-1) are usually unobscured in the X-ray (e.g., Balmaverde et al. 2006; Zhang et al. 2009) and that the lack of optical broad lines is an intrinsic property, not related to selective absorption.
The connection between line and X-ray emission becomes much clearer from the HST emission line fluxes. All objects move toward significantly lower luminosities (see Fig. 3, right panel, and Table 1). This indicates that the line emission is extended and that a fraction of it is lost going from the aperture of the Palomar survey to the HST (which is ~160 times smaller in area). The objects with the lowest line luminosity and EW[O III] values are more affected. With the sole exception of NGC 4459, the objects with EW[O III] < 1 and L [O III] < 1037 erg s-1 do not have a detectable [O III] line and decrease their luminosity by a factor > 10. Moreover the emission line flux of some objects at the high-luminosity end is significantly reduced, by a factor of up to 25, but in all these sources EW[O III] increases.
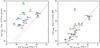 |
Fig. 3 [O III] versus X-ray luminosity for the SUNNS galaxies. In the left panel we use the [O III] measurements from the Palomar survey, in the right panel we report the STIS data. The symbol colors are coded with the EW[O III] values measured in the relative spectrum: green is for objects with EW[O III] > 2 Å, cyan for 1 Å < EW[O III] |


But the most interesting finding is that with the HST line measurements a clear trend between L [O III] and LX emerges with most objects now lying close to the powerful AGN correlation. Apparently, the small HST aperture enabled us to isolate the compact region of line emission in the immediate proximity of the galaxy nucleus, removing the contamination of the diffuse line emission produced in the host galaxy. This nuclear component is closely related to the X-ray emission.
A clear exception is NGC 3982: its offset from the correlation remains very large even considering the HST measurements. Akylas & Georgantopoulos (2009) showed, with XMM observations that it is a highly absorbed source (NH ~ 4.3 × 1023 cm-2) with an X-ray luminosity (0.6 × 1040 erg s-1) much higher than found in our analysis. In the lower signal-to-noise Chandra spectrum the un-absorbed hard X-ray tail (at energies ≳ 3 keV) seen in the XMM data is not visible, and consequently the X-ray flux is underestimated. This is generally expected to be the case for highly X-ray obscured AGN, and indeed Seyfert 2 are all located well above the L [O III] – LX correlation (Heckman et al. 2005). However, these objects can be easily recognized as active galaxies based on the high value of EW[O III].
The novelty of our approach is, in addition to using multi-band data, that we include the value of EW[O III] in the analysis. We now consider the SUNNS galaxies by separating them on the basis of their EW in the ground-based spectra.
In all six galaxies with EW[O III] > 2 Å in the Palomar spectra (see Table 1) the detection in the X-ray (and, in three cases, also in the radio band) supports their identification as AGN. Their EW[O III] increases when using the smaller HST aperture, as expected when the line emission is spatially concentrated toward the galaxy’s nucleus. However, in three of them, the [O III] flux decreases substantially, by a factor of 10–25. This is expected since HST imaging of nearby AGN (Capetti et al. 1996; Falcke et al. 1998) usually reveals line emission extended on a scale much larger than the region covered by the STIS aperture.
Of the five galaxies with intermediate line strengths, 1 Å < EW[O III] ≤ 2 Å, four show an increased EW[O III] in the HST data, reaching values between 2.4 Å and 25 Å. They also show an X-ray nucleus (except in the case of NGC 3992 for which there are no Chandra data available); two of them are also detected in the radio band. The nature of the last galaxy, NGC 3489, is less secure. Although detected in the X-ray, there are no emission lines in its HST spectrum and it does not produce radio emission at a detectable level. A significant problem linked to this galaxy and, more in general to low-luminosity AGN, is the possibility of a contamination from stellar sources, e.g., from X-ray binaries. As discussed by, e.g., Zhang et al. (2009), the probability of such a confusion is relatively low, but it cannot be ruled out in individual cases. This problem is particularly relevant because of the lack of nuclear optical emission lines. Nonetheless, the location of this source in Fig. 3 is consistent with a low-luminosity active nucleus. Deeper optical spectroscopic data are needed to clarify the nature of this source.
Finally, there are seven galaxies with EW[O III] ≤ 1 Å. Four of them do not show any evidence for an active nucleus because there are no visible emission lines in their HST spectra and they are not detected in either the X-ray or the radio bands. To this list we can safely add NGC 4459 whose EW[O III] from HST is only 0.6 Å ,while it lacks of X-ray and radio emission.
But among the objects with a low EW[O III] there is also an object with the characteristics of an AGN, namely NGC 4548, with an EW[O III] growing from 0.9 Å to 2.5 Å according to the Palomar and HST data, and it is detected in both the X-ray and radio data. Finally, NGC 5055 is detected in the X-ray, but without emission lines or radio emission, and, similarly to NGC 3489, its classification remains uncertain.
4. Discussion
We showed that with optical spectroscopy and X-ray imaging at high spatial resolution, such as can be obtained with HST and Chandra, our understanding of the nature of emission line galaxies can be significantly improved with respect to the results derived from ground-based data obtained over large (~10 square arcsec) apertures, in particular concerning the question which among them are AGN and which are not.
By considering together the EW[O III] measured from HST spectroscopy and the detection of a nuclear source in the Chandra data we found that the galaxies of our sample can be separated into two populations.
The 11 objects belonging to the first class have an equivalent width of the [O III] emission line measured from HST data EW[O III] ≳ 2 Å and are associated with an X-ray nuclear source. They are also characterized by an increase of their EW[O III] when moving from the ground-based to the HST measurements. This indicates that the emission line is more highly nuclear concentrated than the continuum (mostly stellar) emission. These are most likely active galaxies.
In the second group we found seven galaxies with EW[O III] ≲ 1 Å that do not generally show any emission related to an active nucleus (emission lines, X-ray, or radio sources). This group includes about half of the LINERs (or transition galaxies) of the sample. These are objects of low [O III] line luminosity ( ≲ 1038 erg s-1) and low equivalent width ( ≲ 1 Å) in ground-based observations.
The HST spectroscopic data alone are already able to distinguish very efficiently between active and non-active galaxies. Indeed, the two classes described above are separated into those lacking nuclear emission lines (corresponding to upper limits of ≲ 1 Å) and those with EW[O III] > 2 Å. All objects with a low EW[O III] in the HST data, and generally also those that lack an X-ray central source, are galaxies of low equivalent width in the Palomar spectra. This strengthens the suggestion presented in Capetti (2011) that this parameter is a good predictor of the nature of an emission line galaxy. Nonetheless, several objects of low EW[O III] (~1–2 Å) from the ground experience a strong increase when observed at high spatial resolution. Furthermore, the concentration at low EW[O III] of the ground-based measurements effectively disappears in the HST data; as explained in the introduction, this effect is difficult to account for lines powered by an AGN.
Similarly powerful is the classification of AGN based on the presence of a nuclear X-ray source in the Chandra data. The comparison of the results obtained with the two instruments generally agree with, confirming the validity of their respective classifications. Only a few objects may be different. These galaxies underline the potential limitations of the X-ray data due to i) a high level of X-ray absorption (as for NGC 3982) or ii) the possible confusion with stellar sources (for NGC 3489 and NGC 5055).
How do these results affect our understanding of how many emission line galaxies are AGN? Apparently, five (but possibly seven) galaxies out of 18 lack of any evidence of an active nucleus. However, the sample considered is biased by the selection of galaxies of high emission line fluxes, and indeed their EW[O III] distribution is not representative of the whole Palomar sample (see Fig. 2). In this sample, the objects located in the AGN region based on their emission line ratios are ~170 (or ~250 including the composite galaxies); 50% of them have EW[O III] < 1 Å and 20% have 1 Å ≤ EW[O III] < 2 Å. Extrapolating our results, the fraction of non-active galaxies among them is ~35–45%. But, even more importantly, we cannot confirm an active nucleus in any of the galaxies with L [O III] ≲ 1038 erg s-1 as measured from ground-based observations.
5. Summary and conclusions
We explored the nature of a sample of 18 emission line galaxies by combining high-resolution observations obtained in different bands, with HST, Chandra, and VLA. All these sources are located in the region populated by AGN in the optical spectroscopic diagnostic diagrams. However, it is still unclear which of these objects, in particular among LINERs, are powered by an active nucleus and for which objects other sources of gas ionization are responsible for the observed emission lines.
No connection was found between X-ray and emission line luminosities from ground-based data, unlike what was found for brighter AGN. Conversely, when using the HST spectroscopic data, which are extracted on a much smaller aperture, a strong correlation emerges, consistent with the link found in more powerful unobscured AGN. This indicates that the ground-based line measurements are severely affected by the contamination of diffuse emission from the host galaxies. Instead, the small HST aperture enabled us to isolate the compact region of line emission in the immediate proximity of the active nucleus, when this is present.
The galaxies separate into two populations. The 11 objects belonging to the first class have an equivalent width of the [O III] emission line measured from HST data EW[O III] ≳ 2 Å and are associated with an X-ray nuclear source; in the second group we find seven galaxies with EW[O III] ≲ 1 Å that do not generally show any emission related to an active nucleus (emission lines, X-ray, or radio sources). This latter group includes about half of the LINERs (or transition galaxies) of the sample, all of which are objects of low [O III] line luminosity (≲1038 erg s-1) and low equivalent width ( ≲ 1 Å) in ground-based observations. These two groups can be associated with a different origin of their emission lines, the first being powered by an active nucleus, the second in which other processes lead to the formation of the lines. This strengthens the suggestion that the EW[O III] value is a better predictor of the nature of an emission line galaxy than its location in the diagnostic diagrams.
How can we further improve the AGN census? For some of the SUNNS objects, the main limiting factor is the quality of their HST and Chandra data. While for a few objects (e.g., NGC 3368 and NGC 4435) significantly deeper Chandra observations can be obtained with a “reasonable” exposure time (~a few tens of ks), this is generally not the case. Similarly, the HST spectra already correspond to about one HST orbit and no order of magnitude improvement can be predicted. From deeper radio data we can expect to obtain additional confirmation of the AGN presence. However, the ratio between radio and optical (or X-ray) luminosities for the five radio detected AGN spans a broad range of ~2 dex. Furthermore, the four galaxies with the highest Palomar line luminosity are not detected by the VLA observations. This stresses the difficulty of predicting a level of radio emission for active nuclei. Radio observation cannot then be used to falsify an AGN, but only to confirm it.
Analyzing a larger number of galaxies is apparently the best way to set our results on a stronger statistical basis. The HST and Chandra archives already contain data for a substantial fraction of galaxies of the Palomar galaxies (~1/4 with STIS/HST and ~2/3 with Chandra).
A promising alternative approach is to obtain ground-based optical spectroscopy, but extracted over a relatively small aperture, ≲ 1 square arcsec. This produces a better match of the size of the aperture and of the emission line region, including, with respect to the HST aperture, a larger part of line emission from any active nucleus, while still limiting the host contamination. Furthermore, the higher flux included in the aperture, combined with a more extended telescope collecting area, will substantially improve the quality of the spectra. This might allow us to reach lower levels of EW[O III], closer to the limit of ~0.1 Å set by the current limitations in describing galaxy spectra with stellar templates (Sarzi et al. 2006). Ideally, integral field units should be used to also measure the spatial distribution of emission lines and stellar continuum.
Ho et al. (1997) and Shields et al. (2007) quote the EW only for Hα; we used these data to measure the ratio between the [O III] and the continuum around the Hα line, i.e., EW[O III]@Hα = log F [O III] /Fcont,Hα.
References
- Akylas, A., & Georgantopoulos, I. 2009, A&A, 500, 999 [NASA ADS] [CrossRef] [EDP Sciences] [Google Scholar]
- Balmaverde, B., Capetti, A., & Grandi, P. 2006, A&A, 451, 35 [NASA ADS] [CrossRef] [EDP Sciences] [Google Scholar]
- Binette, L., Magris, C. G., Stasińska, G., & Bruzual, A. G. 1994, A&A, 292, 13 [NASA ADS] [Google Scholar]
- Capetti, A. 2011, A&A, 535, A28 [NASA ADS] [CrossRef] [EDP Sciences] [Google Scholar]
- Capetti, A., Axon, D. J., Macchetto, F., Sparks, W. B., & Boksenberg, A. 1996, ApJ, 469, 554 [NASA ADS] [CrossRef] [Google Scholar]
- Falcke, H., Wilson, A. S., & Simpson, C. 1998, ApJ, 502, 199 [Google Scholar]
- Filippenko, A. V., & Sargent, W. L. W. 1985, ApJS, 57, 503 [NASA ADS] [CrossRef] [Google Scholar]
- González-Martín, O., Masegosa, J., Márquez, I., Guainazzi, M., & Jiménez-Bailón, E. 2009, A&A, 506, 1107 [NASA ADS] [CrossRef] [EDP Sciences] [Google Scholar]
- Heckman, T. M. 1980, A&A, 87, 152 [NASA ADS] [Google Scholar]
- Heckman, T. M., Ptak, A., Hornschemeier, A., & Kauffmann, G. 2005, ApJ, 634, 161 [NASA ADS] [CrossRef] [Google Scholar]
- Ho, L. C., Filippenko, A. V., & Sargent, W. L. W. 1997, ApJS, 112, 315 [NASA ADS] [CrossRef] [Google Scholar]
- Kewley, L. J., Groves, B., Kauffmann, G., & Heckman, T. 2006, MNRAS, 372, 961 [NASA ADS] [CrossRef] [Google Scholar]
- Mulchaey, J. S., Wilson, A. S., & Tsvetanov, Z. 1996, ApJS, 102, 309 [NASA ADS] [CrossRef] [Google Scholar]
- Nagar, N. M., Falcke, H., & Wilson, A. S. 2005, A&A, 435, 521 [NASA ADS] [CrossRef] [EDP Sciences] [Google Scholar]
- Panessa, F., Bassani, L., Cappi, M., et al. 2006, A&A, 455, 173 [NASA ADS] [CrossRef] [EDP Sciences] [Google Scholar]
- Sarzi, M., Falcón-Barroso, J., Davies, R. L., et al. 2006, MNRAS, 366, 1151 [NASA ADS] [CrossRef] [Google Scholar]
- Sarzi, M., Shields, J. C., Schawinski, K., et al. 2010, MNRAS, 402, 2187 [NASA ADS] [CrossRef] [Google Scholar]
- Shields, J. C., Rix, H.-W., Barth, A. J., et al. 2004, Coevolution of Black Holes and Galaxies [Google Scholar]
- Shields, J. C., Rix, H.-W., Sarzi, M., et al. 2007, ApJ, 654, 125 [NASA ADS] [CrossRef] [Google Scholar]
- Stasińska, G., Vale Asari, N., Cid Fernandes, R., et al. 2008, MNRAS, 391, 29 [Google Scholar]
- Trinchieri, G., & di Serego Alighieri, S. 1991, AJ, 101, 1647 [NASA ADS] [CrossRef] [Google Scholar]
- Zhang, W. M., Soria, R., Zhang, S. N., Swartz, D. A., & Liu, J. F. 2009, ApJ, 699, 281 [NASA ADS] [CrossRef] [Google Scholar]
All Tables
All Figures
|
Fig. 1 Spectroscopic diagnostic diagrams for the 18 galaxies of the SUNNS sample. The solid lines are from Kewley et al. (2006) and separate star-forming galaxies, LINER, and Seyfert; in the first panel the region between the two curves is populated by the composite galaxies. |
| In the text | |
|
Fig. 2 EW[O III] distribution for the Palomar sample (top panel). The first bin contains 299 objects, including 96 emission galaxies whose [O III] line is not detected. In the other panels we show instead the EW[O III] distribution for the SUNNS subsample derived from the Palomar (middle) and the HST (bottom) observations. The filled areas indicate EW[O III] upper limits; the horizontal arrows show the objects with EW[O III] larger than 13 Å. |
| In the text | |
|
Fig. 3 [O III] versus X-ray luminosity for the SUNNS galaxies. In the left panel we use the [O III] measurements from the Palomar survey, in the right panel we report the STIS data. The symbol colors are coded with the EW[O III] values measured in the relative spectrum: green is for objects with EW[O III] > 2 Å, cyan for 1 Å < EW[O III] |
| In the text | |
Current usage metrics show cumulative count of Article Views (full-text article views including HTML views, PDF and ePub downloads, according to the available data) and Abstracts Views on Vision4Press platform.
Data correspond to usage on the plateform after 2015. The current usage metrics is available 48-96 hours after online publication and is updated daily on week days.
Initial download of the metrics may take a while.