Fig. 2
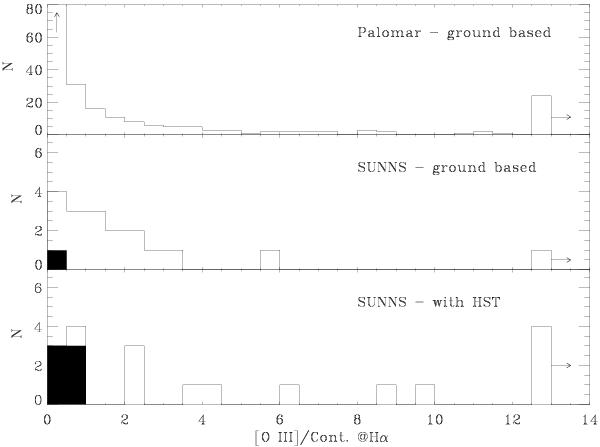
EW[O III] distribution for the Palomar sample (top panel). The first bin contains 299 objects, including 96 emission galaxies whose [O III] line is not detected. In the other panels we show instead the EW[O III] distribution for the SUNNS subsample derived from the Palomar (middle) and the HST (bottom) observations. The filled areas indicate EW[O III] upper limits; the horizontal arrows show the objects with EW[O III] larger than 13 Å.
Current usage metrics show cumulative count of Article Views (full-text article views including HTML views, PDF and ePub downloads, according to the available data) and Abstracts Views on Vision4Press platform.
Data correspond to usage on the plateform after 2015. The current usage metrics is available 48-96 hours after online publication and is updated daily on week days.
Initial download of the metrics may take a while.