Fig. 3
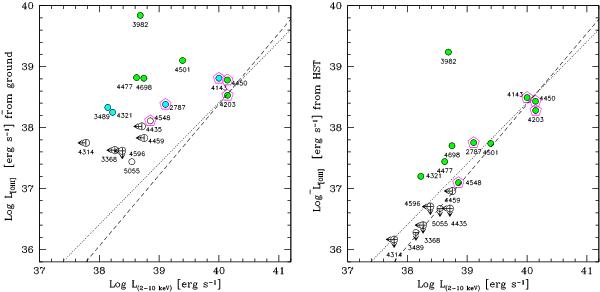
[O III] versus X-ray luminosity for the SUNNS galaxies. In the left panel we use the [O III] measurements from the Palomar survey, in the right panel we report the STIS data. The symbol colors are coded with the EW[O III] values measured in the relative spectrum: green is for objects with EW[O III] > 2 Å, cyan for 1 Å < EW[O III]  Å, and empty for EW[O III]
  1 Å. We denote the sources that are detected in the radio with large purple pentagons. The dashed line reproduces the correlation between L [O III] and LX obtained by Panessa et al. (2006) for a sample of 13 nearby type I Seyfert galaxies; the dotted line marks the locus of constant ratio between line and X-ray luminosities normalized to the value measured by Heckman et al. (2005) in a sample of 20 type I AGNs with bright emission lines, i.e., log LX/L [O III] = 1.59. The median [O III] luminosities of these two samples are log L [O III] ~ 40.0 and ~41.6, respectively.
Current usage metrics show cumulative count of Article Views (full-text article views including HTML views, PDF and ePub downloads, according to the available data) and Abstracts Views on Vision4Press platform.
Data correspond to usage on the plateform after 2015. The current usage metrics is available 48-96 hours after online publication and is updated daily on week days.
Initial download of the metrics may take a while.