| Issue |
A&A
Volume 549, January 2013
|
|
|---|---|---|
| Article Number | A33 | |
| Number of page(s) | 18 | |
| Section | Astrophysical processes | |
| DOI | https://doi.org/10.1051/0004-6361/201015305 | |
| Published online | 12 December 2012 | |
X-ray spectroscopy of the ADC source X1822-371 with Chandra and XMM-Newton
1 Dipartimento di Scienze Fisiche ed AstronomicheUniversità di Palermo, via Archirafi 36, 90123 Palermo, Italy
e-mail: rosario.iaria@unipa.it
2 Dipartimento di Fisica, Università degli Studi di Cagliari, SP Monserrato-Sestu, KM 0.7, 09042 Monserrato, Italy
3 INAF, Istituto di Astrofisica Spaziale e Fisica cosmica di Palermo, via U. La Malfa 153, 90146 Palermo, Italy
4 INAF, Osservatorio Astronomico di Cagliari, Poggio dei Pini, Strada 54, 09012 Capoterra (CA), Italy
5 Institut de Ciències de l’Espai (IEEC-CSIC), Campus UAB, Fac. de Ciències, Torre C5 parell, 2a planta, 08193 Barcelona, Spain
Received: 30 June 2010
Accepted: 16 September 2012
Context. The eclipsing low-mass X-ray binary X1822-371 is the prototype of the accretion disc corona (ADC) sources. Its inclination angle (≃82.5°) is high enough that flux from the neutron star is blocked by the edge-on accretion disc. Because the neutron star’s direct emission is hidden, its ADC emission is visible. The physical properties of the ADC in X1822-371 have been widely studied, but are still debated in literature. In light of the recent literature and of the results reported in this work we show that the ADC is optically thin.
Aims. We analyse two Chandra observations and one XMM-Newton observation to study the discrete features in this source and their variation as a function of the orbital phase, deriving constraints on the temperature, density, and location of the plasma responsible for emission lines.
Methods. The HETGS and XMM/Epic-pn observed X1822-371 for 140 and 50 ks, respectively. We extracted an averaged spectrum and five spectra from five selected orbital-phase intervals that are 0.04–0.25, 0.25–0.50, 0.50–0.75, 0.75–0.95, and, finally, 0.95–1.04; the orbital phase zero corresponds to the eclipse time. All spectra cover the energy band between 0.35 and 12 keV.
Results. We confirm the presence of local neutral matter that partially covers the X-ray emitting region; the equivalent hydrogen column is 5 × 1022 cm-2 and the covered fraction is about 60–65%. We identify several emission lines of He-like and H-like ions, and a prominent fluorescence iron line associated with a blending of Fe i-Fe xv resonant transitions. The transitions of He-like ions show that the intercombination dominates over the forbidden and resonance lines. The line fluxes are the highest during the orbital phases between 0.04 and 0.75.
Conclusions. We discuss the presence of an extended, optically thin corona with optical depth of about 0.01 that scatters the X-ray photons from the innermost region into the line of sight. The photoionised plasma producing the O viii, Ne ix, Ne x, Mg xi, Mg xii, Si xiii, and Si xiv lines is placed in the bulge at the outer radius of the disc distant from the central source of 6 × 1010 cm. The O vii and the fluorescence iron line are probably produced in the photoionised surface of the disc at inner radii. Finally, we suggest that the observed local neutral matter is the matter transferred by the companion star that was expelled from the system by the X-ray radiation pressure, which in turn originated in the accretion process onto the neutron star.
Key words: line: identification / line: formation / stars: individual: X1822-371 / X-rays: binaries / X-rays: general
© ESO, 2012
1. Introduction
X1822-371 is a compact binary system with a period of 5.57 h. The light curve of the source shows an almost sinusoidal modulation and partial eclipse. The partial eclipse indicates a high inclination angle of the system. Initially, Mason & Cordova (1982) derived an inclination angle between 76° and 84° fitting the light curve of X1822-371 in the infrared band. The modulation of the light curve is generally explained with the presence of a geometrically thick disc whose height varies depending on the azimuthal angle and occults part of the X-ray emission (White & Holt 1982; Mason & Cordova 1982; Hellier & Mason 1989; Bayless et al. 2010).
Analysing RXTE data of X1822-371, Jonker & van der Klis (2001) detected a coherent pulsation at 0.59 s, and derived that the orbit of the system is almost circular with an eccentricity less than 0.03, a mass function of (2.03 ± 0.03) × 10-2 M⊙, and a pulse period derivative of (−2.85 ± 0.04) × 10-12 s s-1, indicating that the neutron star is spinning up. The distance to X1822-371 is 2.5 kpc (Mason & Cordova 1982) and the observed luminosity is 1036 erg s-1 (see e.g. Mason & Cordova 1982; Iaria et al. 2001). However, Jonker & van der Klis (2001), using the relation between luminosity and spin-up rate, found that if X1822-371 is at a luminosity of 1036 erg s-1 the neutron star magnetic field B should have an unlikely strength of ~8 × 10¹⁶ G, while for a luminosity of 1038 erg s-1B ~ 8 × 10¹⁰ G. Jonker et al. (2003) constrained the inclination angle of the source at 82.5° ± 1.5° using ultraviolet and visual data of X1822-371. This value implies that the modulation in the light curve of X1822-371 is not caused by dips because these can be observed for inclination angles between 60° and 80° (Frank et al. 2002).
Burderi et al. (2010) analysed the eclipse arrival times of X1822-371 using data from RXTE, XMM-Newton, and Chandra observations, spanning the years from 1996 to 2008. Combining these eclipse arrival time measurements with those already available (covering the period from 1977 to 1996; see Parmar et al. 2000), the authors were able to tightly constrain the orbital period derivative of the binary system to Ṗorb = 1.50(7) × 10-10 s/s, that is three orders of magnitude larger than expected from conservative mass transfer driven by magnetic braking and gravitational radiation. Burderi et al. (2010) concluded that the mass transfer rate from the companion star is between 3.5 and 7.5 times the Eddington limit (i.e. 1.8 × 10⁻⁸ M⊙ yr-1 for a neutron star of 1.4 M⊙), suggesting that the mass transfer has to be highly non-conservative, with the neutron star accreting at the Eddington limit and the rest of the transferred mass expelled from the system.
Bayless et al. (2010), studying the optical and UV data of X1822-371, derived the new optical ephemeris for the source, finding a rapid change of the orbital period with P/Ṗ = (3.0 ± 0.3) × 106 yr, similar to the value of the recent X-ray ephemeris of X1822-371 obtained by Burderi et al. (2010). Bayless et al. (2010) showed that the accretion rate onto the neutron star should be 6.4 × 10⁻⁸ M⊙ yr-1 in a conservative mass transfer, suggesting again a highly non-conservative mass transfer. Finally they fitted the optical light curve of X1822-371, concluding that the disc has a vertically extended component that is optically thick at the optical wavelengths with a height of 0.5 times the accretion disc radius. The authors identified this component as the base of the disc wind.
Recently, Iaria et al. (2011) extended the work of Burderi et al. (2010), including a larger sample of data, and combined the optical/UV data from Bayless et al. (2010) to obtain an updated ephemeris of X1822-371. Iaria et al. (2011) obtained Ṗorb = 1.59(9) × 10-10 s/s from the combined X-ray/optical/UV data set, consistent with the previous measurements. A similar value of the orbital period derivative (Ṗorb = 1.3(3) × 10-10 s/s) was independently obtained by Jain et al. (2010) by analysing data in the X-ray band.
Because of the high inclination angle of the system and the partial eclipse, it has been argued that we do not observe the direct X-ray emission produced in the inner region of the system, but the emission coming from an extended corona above the disc, the so-called accretion disc corona (ADC, White & Holt 1982). The properties of the ADC are still debated. In a scenario with an optically thin ADC we should expect that only a small fraction of the emission produced in the inner region is scattered by the ADC into the line of sight (see e.g. McClintock et al. 1982; Hellier & Mason 1989). On the other hand, an optically thick corona would imply an isotropic re-emission of the primary flux (White & Holt 1982).
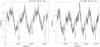 |
Fig. 1 First-order MEG+HEG light curves of X1822-371. The light curves correspond to Obs. ID. 9076 (left panel) and 9858 (right panel), respectively. The bin time is 100 s for both light curves. |
The X-ray spectrum of X1822-371 has been widely debated. Hellier & Mason (1989) fitted the 1–10 keV EXOSAT spectrum of X1822-371 with a black body peaked at 2 keV plus a flat power-law component and an iron emission line at 6.7 keV. The authors inferred that the area of the emitting black-body surface was smaller (~1/400) than the neutron star surface. They proposed that the black-body emission originates from the neutron star surface but the high inclination angle of the system and the tall outer disc would block part of the direct emission from the neutron star, and only a small percentage of the radiation is visible to the observer because it is scattered by an optically thin corona. The power law component was associated with the emission from the inner accretion disc.
Heinz & Nowak (2001) analysed simultaneous observations with Rossi X-Ray Timing Explorer (RXTE) and ASCA of X1822-371. They showed that both the source spectrum and light curve can be well-fitted by two equivalent models, representing the scenario in which X1822-371 has an optically thick corona or an optically thin corona, respectively. In the first case, no soft thermal component from the inner region contributes to the source spectrum, and the emission from the optically thick corona is described by a cutoff power law partially absorbed by a cold gas that is the atmosphere of the outer disc. In the second case, the model consists of a black-body component emitted from the central region, the neutron star surface and/or the inner disc, plus a Comptonised component produced in the optically thin corona and fitted with a cutoff power law in the spectrum. Both these models were able to describe the data adequately.
Iaria et al. (2001) analysed a BeppoSAX observation of X1822-371, finding that the continuum emission is well-fitted using a Comptonised component with an electron temperature of 4.5 keV that is partially covered by a local neutral absorber. The authors suggested that the Comptonised emission is caused by a diffuse emission from the ADC while the partial covering is produced by a cold wall subtending an angle of 16° with respect to the equatorial plane and placed in the external edge of the accretion disc. Parmar et al. (2000) fitted the BeppoSAX data of X1822-371 adopting a continuum model composed of a Comptonised component plus a black body. The electron temperature of the Comptonising region was 4.53 ± 0.02 keV, the optical depth was 26.2 ± 0.6, the seed-photon temperature was 0.15 ± 0.02 keV and the black-body temperature was 1.27 ± 0.03 keV.
Cottam et al. (2001), analysing a Chandra observation of X1822-371 with the High-Energy Transmission Grating Spectrometer (HETGS), identified several emission lines produced in a photoionised plasma. The lines were associated with highly ionised iron, silicon, magnesium, neon, and oxygen, and with a prominent fluorescence iron line at 6.4 keV. The emission region of the photoionised lines was placed at the inner part of the X-ray illuminated bulge that is at the point of impact between the disc and the accretion stream from the companion star, whereas the origin of the fluorescence iron line was located in an extended region on the disc illuminated by the light scattered by the corona.
Recently Ji et al. (2011), analysing Chandra data sets also used for this paper, measured the Doppler velocities of several lines. They divided the observation into 40 intervals and moved a phase window with a width of 0.16 in phase across the 40 intervals, so that each interval had a phase shift of 0.025 from the previous, and therefore the intervals partially overlap in phase. Ji et al. (2011), measuring the Doppler velocity modulation of several ionised lines, inferred that the observed photo-ionised emission lines originate from a confined region in the outer edge of the accretion disc near the hot spot. The photo-ionised plasma where the lines originate was consistent with ionisation parameters ξ > 100. Ji et al. (2011), combining the disc size and reasonable assumptions for the plasma density (between 1012 and 1014 cm-3), suggested that the illuminating disc luminosities are more than an order of magnitude higher than what is actually observed and concluded that the central emitting X-ray source is not directly observed.
We follow a different approach by obtaining information on the lines as a function of the orbital phase from five independent intervals. In this paper we analyse two Chandra/HETGS observations and one XMM-Newton observation of X1822-371 for a total observing time of 140 and 50 ks, respectively. We discuss the averaged spectrum and the phase-resolved spectra and compare our results with past results discussed in literature.
2. Observations
2.1. Chandra observations
X1822-371 was observed with the Chandra observatory from 2008 May 20 22:53:00 to 2008 May 21 17:06:51 UT (Obs. ID. 9076) and from 2008 May 23 13:20:56 to 2008 May 24 12:41:54 UT (Obs. ID. 9858) using the HETGS for a total observation time of 66 and 84 ks, respectively. Both observations were performed in timed faint mode. The HETGS consists of two types of transmission gratings, the medium-energy grating (MEG) and the high-energy grating (HEG). The HETGS provides high-resolution spectroscopy from 1.2 to 31 Å (0.4–10 keV) with a peak spectral resolution of λ/Δλ ~ 1000 at 12 Å for the HEG first order. The dispersed spectra were recorded with an array of six charge-coupled devices (CCDs) that are part of the advanced CCD imaging spectrometer-S (Garmire et al. 2003). The current relative accuracy of the overall wavelength calibration is 0.05%, leading to a worst-case uncertainty of 0.004 Å in the first-order MEG and 0.006 Å in the first-order HEG. The brightness of the source required additional efforts to mitigate “photon pile-up” effects of the zeroth-order events. A 512 row “subarray” (with the first row =1) was applied during the observation, reducing the CCD frame time to 1.7 s. Pile-up distorts the count spectrum because detected events overlap and their deposited charges are collected into single, apparently more energetic, events. We omitted the zeroth-order events from our spectral analysis and studied only the grating first-order spectra, which were not affected by pile-up.
We processed the event list using available software (FTOOLS ver. 6.2 and CIAO ver. 4.1.2 packages) and computed aspect-corrected exposure maps for each spectrum, which allowed us to take into account their effects on the effective area of the CCD spectrometer. We barycentred the events using the tool axbary in CIAO and show the 100 s bin time light curves (merged HEG and MEG first-order events) corresponding to Obs. ID. 9076 and 9858 in Fig. 1. In Fig. 2, we show the folded the light curves adopting the recent X-ray ephemeris of Iaria et al. (2011) and using 128 channels per period. The mean count rate of both observations is 5 cts/s out of the eclipse.
2.2. XMM-Newton observation
The XMM-Newton Observatory (Jansen et al. 2001) includes three 1500 cm2 X-ray telescopes each with an European Photon Imaging Camera (Epic, 0.1–15 keV) at the focus. Two of the EPIC imaging spectrometers use MOS CCDs (Turner et al. 2001) and one uses pn CCDs (Strüder et al. 2001). Reflection grating spectrometers (RGS, 0.35–2.5 keV, den Herder et al. 2001) are located behind two of the telescopes. The region of sky containing X1822-371 was observed by XMM-Newton between 2001 March 07 13:12:48 UT and March 08 03:32:53 UT (Obs. ID. 0111230101) for a duration of 53.8 ks. During the observation the MOS1 and MOS2 camera were operated in fast uncompressed mode and small window mode, respectively. The Epic-pn camera was operated in timing mode with medium filter during the observation. In this mode only one central CCD is read out with a time resolution of 0.03 ms. This provides a one dimensional ( wide) image of the source with the second spatial dimension being replaced by timing information. The faster CCD readout results in a much higher count rate capability of 800 cts/s before charge pile-up becomes a serious problem for point-like sources. The Epic-pn count rate of the source was about 50 cts/s, which avoids telemetry and pile-up problems.
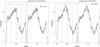 |
Fig. 2 Folded light curves corresponding to Obs. ID. 9076 (left panel) and Obs. ID. 9858 (right panel). The data were folded adopting the X-ray ephemeris obtained by Iaria et al. (2011) and using 128 channels per period. The vertical lines indicate the phase intervals used for the phase-dependent spectral analysis (see Sect. 3.3). |
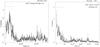 |
Fig. 3 RGS1 background light curve (left panel) and Epic-pn background light curve (right panel). The horizontal segments indicate the time interval excluded from our analysis. The bin time is 100 s. |
For our analysis we used only RGS and Epic-pn data since the Epic-pn covers the same energy range as the MOS CCDs and has a larger effective area. We extracted the X-ray data products of RGS and Epic-pn camera using the science analysis software (SAS) version 9.0.0 extracting only single and double events (patterns 0 to 4) from Epic-pn data. We selected source Epic-pn events from a 69.7″ wide column (RAWX between 29 and 45) centred on the source position (RAWX = 38).
Using the SAS tools, we accumulated the RGS1 and Epic-pn background light curves. The RGS1 background light curve, plotted in Fig. 3 (left panel), shows a flare (possibly due to solar contamination) during the first 10 ks. We excluded this time interval from our analysis because of its spurious origin. The Epic-pn background light curve was extracted from the columns between 2 and 18 and for energies between 10 and 12 keV (see Fig. 3, right panel). Together with the large flare in the first 10 ks, a smaller flare is seen between 37 and 41 ks in the Epic-pn light curve; we excluded these two time intervals and barycentred the events using the tool barycen in SAS to study the orbital-phase resolved spectrum.
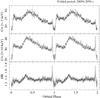 |
Fig. 4 Upper (middle) panel: Epic-pn 1–3 keV (3–10 keV) folded light curves. Lower panel: Epic-pn hardness ratio for the two energy-selected light curves shown above. The data were folded adopting the recent X-ray ephemeris obtained by Iaria et al. (2011) and using 256 channels per period. |
Finally, we show in Fig. 4 the Epic-pn folded light curves selected in the energy bands 1–3 keV and 3–10 keV, and the folded hardness ratio (HR) obtained from the ratio of the 3–10 keV folded light curve over the 1–3 keV folded light curve. We note that the HR is similar to that obtained by Iaria et al. (2001) and Parmar et al. (2000) using BeppoSAX data of X1822-371. The largest effective area of the Epic-pn allows us to clearly observe a small variation of the HR, from 1.5 to 1.9, which immediately preceeds the eclipse at the orbital phase 0.949. This feature was already present in the HR shown by Iaria et al. (2001), Parmar et al. (2000), and Hellier & Mason (1989). Furthermore, we confirm that the depth of the partial eclipse increases with increasing energy as shown by Parmar et al. (2000).
3. Spectral analysis
3.1. The averaged spectrum
Chandra data were extracted from regions around the grating arms; to avoid overlapping between HEG and MEG data, we used a region size of 25 and 33 pixels for the HEG and MEG, respectively, along the cross-dispersion direction. The background spectra were computed, as usual, by extracting data above and below the dispersed flux. The contribution from the background is 0.4% of the total count rate. We used the standard CIAO tools to create detector response files (Davis 2001) for the HEG-1 (MEG-1) and HEG+1 (MEG+1) order (background-subtracted) spectra. After verifying that the negative and positive orders were compatible with each other in the whole energy range, we coadded them using the script add_grating_orders in the CIAO software, obtaining the first-order MEG spectrum and the first-order HEG spectrum for each of the two observations. We summed the first-order HEG (and MEG) spectra of the two Chandra observations to increase the statistics with the CIAO script add_grating_spectra and obtained a total exposure time of 142 ks. The MEG and HEG energy range is 0.5–6 keV and 0.8–10 keV, respectively. Finally, we rebinned the first-order MEG and first-order HEG spectra to have at least 25 counts per energy channel.
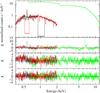 |
Fig. 5 Data and residuals of RGSs and Epic-pn spectra. Second panel from the top: residuals using the model phabs*(f*cabs*phabs*(CompTT)+(1-f)*CompTT). Third panel from the top: residuals adding nine Gaussian components to the previous model to fit the lines. Bottom panel: residuals adding a black-body component to the model. |
We extracted the RGS1, RGS2, and Epic-pn spectra from the whole observation with an exposure time of 43, 42, 38 ks, respectively. We adopted a 0.35–2 keV energy range for RGS spectra and 0.6–12 keV for the Epic-pn spectrum. The Epic-pn spectrum was rebinned so that the energy resolution was not oversampled by more than a factor 4 and to have at least 25 counts per energy channel. The RGS1 and RGS2 spectra were rebinned to have at least 25 counts per energy channel.
The HETGS and XMM spectra were fitted separately using XSPEC version 12.6.0. We fitted the continuum emission adopting the model proposed by Iaria et al. (2001) for the broad band BeppoSAX spectrum of X1822-371: i.e. a Comptonised component (CompTT in XSPEC) partially absorbed by neutral matter and absorbed by interstellar matter (phabs in XSPEC, using the abundances of Asplund et al. 2009). We also took into account the effect of Thomson scattering in the local cold absorber using the cabs component in XSPEC. The adopted model consists of the component phabs*(f*cabs*phabs*(CompTT)+(1-f)*CompTT), where f is the neutral matter covering fraction; the first phabs component was used to fit the photoelectric absorption by interstellar neutral matter, the second phabs component takes into account the photoelectric absorption by local neutral matter. We imposed that the value of the equivalent hydrogen column density of the cabs component is the same as that of the neutral local matter, assuming that the local neutral matter is responsible for both the photoelectric absorption and Thomson scattering.
Fitting the RGS and Epic-pn spectra, we obtain a  of 1.86(2422). The residuals reported in Fig. 5 (the second panel from the top) show several local features and a mismatch between the RGS and Epic-pn data in the energy range between 0.6 and 0.8 keV. We improved the model by adding nine Gaussian components to fit the localised features. The centroids of the Gaussian profiles are at 0.569, 0.652, 0.914, 1.02, 1.34, 1.98, 6.40, 6.70, and 6.99 keV, associated with the O vii intercombination line, O viii, Ne ix intercombination line, Ne x, Mg xi intercombination line, Si xiv, Fe i, Fe xxv intercombination line, and Fe xxvi, respectively. The addition of the Gaussians improved the fit, giving a Δχ2 of 1691 and a of 1.17(2401); the corresponding residuals are shown in Fig. 5 (the third panel from the top). To improve the fit at low energies, where RGS and Epic-pn data are mismatched, we added a black-body component (bbody in XSPEC) to our model, partially absorbed like the Comptonised component. Since the best-fit gives a value of 0.06 keV for the black-body temperature and for the seed-photon temperature of the CompTT component, we constrained the two parameters to assume the same value and fitted the data again. The addition of the black-body component improved the fit, giving a Δχ2 of 250 and a
  of 1.06(2400). We report the corresponding residuals in Fig. 5 (bottom panel). The best-fitting values of the parameters of the continuum are reported with an associated error at 90% confidence level (c.l.) in Table 1 and the best-fitting values of the line parameters are reported in Table 2 (associated error at 68% c.l.).
We fitted the HETGS data with the same best-fit continuum as adopted above, obtaining a value of  ; we observed several emission features in the residuals as shown in Fig. 6. To fit the residuals, we added eleven Gaussian components and identified the emission lines associated with the following transitions: O vii intercombination line, O viii Lyα, Ne ix intercombination line, Ne x Lyα, Mg xi intercombination line, Mg xii Lyα, Si xiii intercombination line, Si xiv Lyα, Fe i Kα, Fe xxv intercombination line, and, finally, Fe xxvi Lyα. The addition of the Gaussian components improved the fit with a Δχ2 of 807 and a value of of 0.82(6125). The best-fit values of the continuum parameters and the best-fit values of the line parameters are reported in Tables 1 and 2, respectively.
The black-body component added to fit the XMM spectrum below 0.8 keV is not present in the model shown by Iaria et al. (2001). This component was also added to fit the Chandra averaged spectrum, fixing its temperature to the best-fit value obtained by the XMM averaged spectrum. We obtained a consistent value for its normalisation.
Averaged spectrum. Best-fit values of the continuum parameters.
Averaged spectrum. Emission lines of X1822-371.
Finally, we checked the presence in the RGS spectrum of the Mg xii and Si xiii lines, which are significantly detected in the HETGS spectrum. We added two Gaussian components in the XMM averaged spectrum, keeping the centroids and the widths fixed to the values obtained from Chandra. We obtained an upper limit to the flux of the Mg xii and Si xiii line of <0.12 × 10⁻⁴ and <0.5 × 10⁻⁴ ph cm-2 s-1, respectively. These fluxes suggest that the Mg xii line might be absent during the XMM observation while the Si xiii line is compatible with that observed in the Chandra averaged spectrum.
3.2. Helium-like series and the NeIX RRC feature
The intercombination lines associated with O vii (RGS1 spectrum), Ne ix (MEG spectrum), and Mg xi (MEG spectrum) have a significance larger than 7σ but we do not have evidence for the corresponding forbidden and resonance lines. To determine the intensity of the O vii lines, we analysed the energy range between 0.555 and 0.58 keV, fixing the best-fitting values of the continuum emission. We studied the O vii triplet using RGS1 and MEG data. In the MEG and RGS1 spectra we fixed the energy of the forbidden line at the rest-frame value of 0.5610 keV, while the energies of the intercombination and resonance lines were let free to vary. The line widths were constrained to assume the same value. Using the best-fitting intensities reported in Table 3, we derived the parameter G = (f + i)/r and R = f/i, where f, i, and r are the intensities of the forbidden, intercombination, and resonance lines, respectively. We find that  and G = 7 ± 4 for MEG and RGS1 data and R is less than 0.07 and 0.02 for MEG and RGS1, respectively (the associated errors are at 68% c.l.). We used the MEG data between 0.89 and 0.93 keV to estimate G and R of the Ne ix triplet. We fixed the forbidden line energy at the rest-frame value of 0.9051 keV and imposed the widths of the three lines to be the same, finding
  and
and  . Finally, we used the MEG data between 1.32 and 1.37 keV to determine G and R of the Mg xi triplet, we fixed the energies of the forbidden and resonance line at the rest-frame values of 1.3312 and 1.3523 keV, while the line widths were constrained to assume the same value. We obtained
  and
and  .
.
Cottam et al. (2001) found a radiative recombination continuum (RRC) feature associated with the Ne ix transition in a previous Chandra/HETGS observation of X1822-371. They found an energy threshold of 13 ± 7 eV, corresponding to a plasma temperature of (1.5 ± 0.8) × 105 K. We searched for this feature in our data by adding an inverse edge component (redge in XSPEC) to assess the presence of the RRC feature. We fixed the energy threshold at 1.196 keV (that is the energy of the Ne ix transition) and found only marginal evidence for the RRC feature (Δχ2 = 2.8), with a temperature <14 eV corresponding to a temperature of <1.6 × 10⁵ K.
3.3. Phase-dependent spectral analysis
We selected the following five phase-intervals 0.04–0.25, 0.25–0.50, 0.50–0.75, 0.75–0.95, and 0.95–1.04, respectively. This selection allows us to constrain both continuum emission and discrete features for each of phase-interval. The intervals correspond to the count rate rise after the eclipse, the maximum, the count rate decrease, the minimum and, finally, the eclipse, respectively, as shown in Fig. 2.
For each phase-interval we produced a spectrum using the same procedure as adopted for the averaged spectrum. We label the spectra extracted from the phase-intervals 0.04–0.25, 0.25–0.50, 0.50–0.75, 0.75–0.95, and 0.95–1.04 with 1, 2, 3, 4, and 5, respectively. The exposure times of the spectra corresponding to the five phase-intervals are reported in Table 4. The MEG, HEG, RGS, and EPIC-pn selected energy ranges are the same as adopted to fit the averaged spectrum. The model to fit the XMM spectra is the same as used to fit the averaged spectrum, while we fitted the five Chandra spectra excluding the black-body component because of the low statistics below 0.6 keV in the MEG. Furthermore, we fixed the NH value to 0.163 × 1022 cm-2 in the Chandra and XMM spectra and, in the Chandra spectra, the seed photon temperature of the Comptonised component was fixed to the values obtained from the best-fit of the corresponding XMM spectrum.
We obtained acceptable fits, the XMM spectra having  (d.o.f.) of 1.00(815), 1.04(982), 0.98(1080), 1.00(707), and 0.97(475) for spectra 1, 2, 3, 4, and 5, respectively. The best-fit parameters are shown in Tables 5 and 6. The electron temperature kTe does not change with the orbital phase (see top panel of Fig. 8), while the optical depth τ of the Comptonised component is about 20 at all orbital phases except between 0.75–0.95, when it increases up to 23 (see middle panel of Fig. 8). We show the unabsorbed flux in the 0.4–12 keV energy range associated with the Comptonised component that was obtained using the cflux component of XSPEC in the bottom panel of Fig. 8, where the open squares and the dots indicate the Chandra and XMM unabsorbed fluxes, respectively. The behaviour of the unabsorbed fluxes obtained from the XMM and Chandra phase-resolved spectra is similar along the orbit. The Chandra unabsorbed fluxes are a factor 1.4 higher than the those of XMM in all selected phase-intervals.
The equivalent hydrogen column associated with the local neutral matter, NHpc, reaches the maximum at phases between 0.25–0.50 when the unabsorbed flux is maximum. It assumes the minimum value at phases between 0.75–0.95 (see Fig. 9, upper panel). A similar behaviour of NHpc and f was already found by Heinz & Nowak (2001) out of eclipse from analysing ASCA and RXTE data simultaneously (see Table 2 in their work). However, we found that the values of NHpc and f increase again during the eclipse, while Heinz & Nowak (2001) found a further drop.
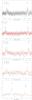 |
Fig. 6 Residuals of first-order MEG (black points) and HEG (red points) spectra using the continuum shown in the text. The emission lines are indicated in the panels. |
The emission lines are clearly detected during most orbital phases, as shown in Table 6. The HETGS lines are evident during the phases between 0.04 and 0.75, that is out of the minimum in the light curve and eclipse. In spectra 1, 2, and 3 we fixed only the width of the O vii line at the values obtained in the averaged spectrum because of the low statistics below 0.6 keV. In spectra 2 and 3 we fixed the width of the O viii line at the best-fit value obtained in spectrum 1. The other parameters of the O vii and O viii lines were left free to vary in spectra 1, 2, and 3. Furthermore, all parameters associated with the other detected lines were left free to vary in spectra 1, 2, and 3. In spectrum 4 (phase 0.75–0.95) we fixed both the energies and the widths of the O vii and O viii by obtaining upper limits for the corresponding fluxes; moreover, we fixed the widths of the Ne x, Mg xi, Mg xii, Si xiv, and Fe xxvi lines at their best-fit values. In spectrum 5 (phase 0.95–1.04) we found an upper limit for the O vii and O viii, while we fixed the widths of the other detected lines at their best-fit values.
In the XMM spectra we fixed the width of the weak Fe xxv line at 20 eV as in the averaged XMM spectrum. We fixed the width of the O viii line at the corresponding upper limit obtained from XMM spectrum 1 in spectra from 2 to 5. In XMM spectrum 2 we fixed the width of the Fe xxvi lines at the corresponding upper limit obtained in spectrum 1. In XMM spectrum 4 we fixed the energy and the width of the Ne ix line, the width of the Si xiv line, and the width of the Fe xxv line at their best-fit values. In XMM spectrum 5 the widths were fixed at their best-fit values. The equivalent widths in units of eV of the most prominent lines are shown in Table 7.
4. Discussion
We analysed one XMM and two HETGS observations of X1822-371, studying the averaged spectrum and the orbital-phase resolved spectra. The best-fit value of the equivalent hydrogen column associated with neutral interstellar matter, NH ~ 0.16 × 1022 cm-2, is similar to that obtained by Iaria et al. (2001) (i.e.  cm-2) and to the value of ~ 0.16 × 1022 cm-2 obtained by Ji et al. (2011), who fitted the HETGS spectrum of X1822-371 with a power-law component absorbed by local neutral matter. The values of equivalent hydrogen column associated with local neutral matter, NHpc, obtained by fitting the XMM and Chandra averaged spectra are compatible with each other and consistent with the value reported by Iaria et al. (2001) (about 4.4 × 1022 cm-2) and by Ji et al. (2011) (between 5.4 and 6.3 × 1022 cm-2). Finally, we found that the covered X-ray emitting surface is about 60–65%.
The spectra show several emission lines associated with ionised elements and a fluorescence iron line, as already shown by Cottam et al. (2001) and Ji et al. (2011).
We observed significant residuals in EPIC-pn data below 0.8 keV. To remove them we added a black-body component with a temperature of 0.06 keV and a corresponding luminosity of (6.3 ± 1.3) × 1034 erg/s, a factor of one hundred smaller that the luminosity of the Comptonised component. We will not discuss this component in more detail because we cannot distinguish between a real effect of an instrumental artefact of the Epic-pn below 0.8 keV. Future observations, e.g. with Astro-H, will allow one to asses the physical origin of this component.
Best-fit values of the O vii, Ne ix, and Mg xi triplets.
The 0.1–100 keV extrapolated unabsorbed fluxes of the Comptonised component obtained from the XMM and Chandra averaged spectra are 9.2 × 10⁻¹⁰ and 1.3 × 10⁻⁹ erg cm-2 s-1, respectively. To check the consistency of the measured fluxes in the two observations, we inspected at the long-term light curve provided by the All-Sky Monitor (ASM) on board the RXTE satellite. During the XMM and Chandra observations the ASM averaged count rate was 1.3 ± 0.2, and 1.7 ± 0.2 c/s, respectively. The ratio between the ASM count rate during the Chandra observation, ASMCh, and the XMM observation, ASMXMM, is 1.3 ± 0.3, and the ratio of the 0.1–100 keV extrapolated unabsorbed Chandra and XMM flux is 1.4, compatible with the ratio ASMCh/ASMXMM. The proportionality of the ASM count rates to the unabsorbed fluxes suggests that the spectral shape of X1822-371 does not change significantly with time. Adopting a distance to the source of 2.5 kpc (Mason & Cordova 1982, hereafter we will use this distance), the extrapolated observed luminosity in the 0.1–100 keV energy range is 7 × 1035 erg s-1 and 1036 erg s-1 for the XMM and Chandra averaged spectra, respectively.
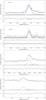 |
Fig. 7 Forbidden (green), intercombination (blue), and resonance (red) lines of the O vii, Ne ix and Mg xi triplets. From top to bottom: RGS1 data and residuals of the O vii triplet; first-order MEG data and residuals of the O vii triplet; first-order MEG data and residuals of the Ne ix triplet; first-order MEG data and residuals of the Mg xi triplet. |
Exposure times of the selected phase-intervals.
Best-fit values of the continuum parameters as a function of the orbital phase of X1822-371.
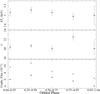 |
Fig. 8 Parameters of the Comptonised component obtained fitting the XMM data: electron temperature (top), optical depth (middle), and the unabsorbed flux in units of 10-10 erg s-1 cm-2 (bottom) in the 0.4–12 keV energy band, the open squares and the dots are the values obtained from the Chandra and XMM spectra, respectively. |
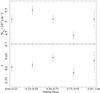 |
Fig. 9 Best-fit values of the equivalent hydrogen column density associated with the local neutral matter (upper panel) and the fraction f of the emitting region covered by local neutral matter (lower panel). |
In the following we propose a possible interpretation of the features observed in the X-ray spectrum of X1822-371. We propose a scenario in which 1) the modulation of the light curve is mainly caused by the occultation by the outer accretion disc (Sect. 4.1); 2) only 1% of the luminosity produced in the innermost region of X1822-371 is scattered by an extended optically thin corona into the line of sight (Sect. 4.2); 3) the photoionised lines of O viii, Ne ix, Ne x, Mg xi, Mg xii, and Si xiv are produced in a compact region at the outer radius of the accretion disc (Sect. 4.4); 4) the Fe xxvi line is produced at a distance from the neutron star less than 3.7 × 1010 cm (Sect. 4.4); 5) the O vii and the fluorescence iron line are produced in the photoionised surface of the accretion disc at radii between 2 × 10¹⁰ and 4 × 1010 cm (Sects. 4.4 and 4.5); 6) the neutral matter that partially covers the scattered emission is placed at a distance from the neutron star comparable to, or larger than, the outer accretion disc radius (Sect. 4.3).
4.1. The presence of an opaque shield
Our best-fit model consists of an optically thick Comptonised spectrum absorbed by neutral interstellar matter that is partially absorbed and Thomson-scattered by local neutral matter. However, even taking into account the Thomson scattering, this model does not explain the different values of the unabsorbed flux for the five selected phase-intervals. The 0.4–12 keV unabsorbed flux obtained from the XMM data changes along the orbital period from (7.22 ± 0.03) × 10-10 erg cm-2 s-1 in the phase-interval 0.25–0.50 down to (4.05 ± 0.06) × 10-10 erg cm-2 s-1 during the eclipse (see Fig. 8, bottom panel). Burderi et al. (2010) gave strong evidence that the neutron star in X1822-371 accretes at the Eddington limit while the companion star has an overall mass outflow between 3.5 and 7.5 times the maximum Eddington accretion rate ṁE for a 1.4 M⊙ neutron star. Consequently, we should expect that the unabsorbed flux of the system is constant at the Eddington limit along the orbital period. The observed changes of the flux can be explained by the presence of an opaque shield whose height varies along the orbital phase. The presence of an opaque shield in X1822-371 was already discussed by several authors (see e.g. White & Holt 1982; Mason & Cordova 1982; Hellier & Mason 1989; Bayless et al. 2010), who suggested that the outer accretion disc of X1822-371 is geometrically thick and its height depends on the azimuthal angle. The 0.4–12 keV unabsorbed flux for the phase intervals 0.04–0.25, 0.50–0.75, 0.75–0.95, and 0.95–1.04 is 83%, 91%, 76%, and 56%, respectively, as a percentage compared to that during the phase interval 0.25–0.50. The highest flux reduction during the phase-interval 0.95–1.04 is due to the occultation caused by the companion star.
Emission lines of X1822-371.
Line equivalent widths along the orbital period.
On the other hand, the equivalent hydrogen column of the local neutral matter and the corresponding covering fraction f are correlated with the light-curve modulation (see Figs. 2 and 9) in the sense that their best-fit values increase when the count rate increases and reach the minimum when the count rate is minimum (out of the eclipse). This suggests that we cannot ascribe the observed light-curve modulation to the local neutral matter because if that were the case, we should expect a rise of the equivalent hydrogen column of the local matter and/or of the covering fraction f when the count rate drops at phases 0.75–0.95.
Because we identify the opaque shield with the outer accretion disc, we expect that it is the highest when the unabsorbed flux is minimum and, conversely, the lowest when the unabsorbed flux is maximum; in other words, the height of the outer disc is minimum at phases 0.25–0.50 and maximum at phases 0.75–0.95. In agreement with Cottam et al. (2001) and other authors we propose that the changes of the height at the outer rim is caused by the impact with the outer disc of matter coming from the companion star. At the impact point we expect the largest height of the outer radius of the accretion disc.
4.2. The continuum emission and presence of an optically thin ADC
Although we find the same spectral shape reported by Iaria et al. (2001), in this work we will give a different interpretation of its origin in light of the recent results reported by Burderi et al. (2010), Bayless et al. (2010), and Iaria et al. (2011), which showed a large derivative of the orbital period of X1822-371. Burderi et al. (2010) showed that the large orbital-period derivative of X1822-371 indicates that the system accretes at the Eddington limit. Another indication that the luminosity of X1822-371 is at the Eddington limit is given by the ratio LX/Lopt, where LX and Lopt are the X-ray and optical luminosity. Hellier & Mason (1989) showed that the ratio LX/Lopt for X1822-371 is ~20, a factor 50 smaller than the typical value of 1000 for the other LMXBs. This indicates that the intrinsic X-ray luminosity is underestimated by at least a factor of 50. Finally, Jonker & van der Klis (2001) showed that for a luminosity of X1822-371 of 1036 erg s-1 the magnetic field intensity of the neutron star assumes an unlikely value of 8 × 10¹⁶ G, while for a luminosity of the source at the Eddington limit it assumes a more conceivable value of 8 × 10¹⁰ G. These three independent arguments lead us to assume that the intrinsic luminosity of X1822-371 is close to the Eddington limit; hence the first point that we discuss is why the observed luminosity of X1822-371 is 1036 erg s-1 (see e.g. Hellier & Mason 1989; Heinz & Nowak 2001; Parmar et al. 2000; Iaria et al. 2001, and this work).
Considering that the outer disc is thick and that the inclination angle of the system is 82.5° ± 1.5°, we do not observe the direct emission from the innermost region and invoke the presence of an extended corona above the disc that scatters 1% of the Eddington X-ray luminosity along the line of sight. A similar scenario was discussed by McClintock et al. (1982) for 4U 2129+47 and by Hellier & Mason (1989) for this source. This scenario is different from that proposed by Iaria et al. (2001) and other authors, according to which the continuum emission originates in an extended optically thick corona that has a luminosity of 1036 erg s-1. Indeed, if an extended optically thick corona is present, a large part of the Eddington luminosity should be reprocessed there and re-emitted, and the observed luminosity would be almost 1038 erg s-1, unless one considers the unlikely scenario in which the emission from the inner region of X1822-371 is extremely beamed.
The photons produced in the innermost region near the NS are Comptonised in an optically thick plasma (τ ≃ 20) with a temperature of 3 keV, producing the main spectral component observed in the X-ray spectrum. The Comptonising cloud is probably a compact region near the NS. X1822-371 has a peculiar geometry for two reasons: the system is observed at high inclination angle and the height of the outer accretion disc is large. Combining these two effects, we infer that we do not observe the direct emission L0 from the central region, but only the emission scattered by an extended corona. The scattered flux, considering τC ≪ 1, is L0 [(1 − e − τC)/(4πD2)] ≃ L0τC/(4πD2), where D is the distance to the source. Therefore the scattered flux is τC times the emission produced near the NS. Assuming that τC ~ 0.01 we match the expected luminosity at the Eddington limit and the observed luminosity of ~1036 erg/s.
Jonker et al. (2003) found that the mass function of X1822-371 is (2.03 ± 0.03) × 10-2 M⊙. Assuming a typical NS mass of 1.4 M⊙, we derive a companion star mass of 0.408 M⊙. Considering that the orbital period of X1822-371 is 5.57 h, we derive that the orbital separation is a = 1.34 × 1011 cm using the third Kepler law. The Roche lobe of the NS and the companion star are RL1 = 9.8 × 1010 cm and RL2 = 3.7 × 1010 cm, respectively. For a mass ratio q = M2/M1 ≃ 0.3, the tidal truncation radius, that is the maximum possible value of the accretion disc radius Rd, is 0.43a = 5.7 × 1010 cm (Frank et al. 2002; Bayless et al. 2010). We adopt Rd = 5.7 × 1010 cm as outer accretion disc radius. The estimated orbital parameters allow us to infer the size of the optically thin corona, making the reasonable assumption that the Roche lobe radius RL2 of the companion star is equal to the radius of the companion star R2.
We can estimate the size of the ADC taking into account the different count rates observed at mid-eclipse time and out of the eclipse. Since the spectral shape does not change along the orbit, we impose that the change in count rates, in and out the eclipse, is mainly due to the volume of the visible optically thin ADC occulted by the companion star. Looking at the HETGS folded light curves of X1822-371 in Fig. 2, we observe that the count rate is Cecl ~ 3 cts s-1 at the mid-eclipse time while it changes between 4 and 6.6 cts s-1 out of the eclipse. The maximum observed count rate Cout indicates the minimum shielding and allows us to give a more accurate estimate of the ADC size. We also note that the values of Cecl and Cout in the EPIC-pn light curves are 37 and 84 cts s-1, respectively; we obtain consistent results using EPIC-pn or HETGS count rates. Assuming a spherical volume of the ADC, the scattering volume is proportional to Cout out of the eclipse, while the scattering volume of the ADC subtracted by the volume occulted by the companion star is proportional to Cecl during the eclipse. That is
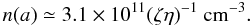
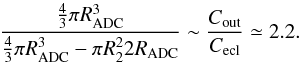 We find that RADC ~ 6 × 1010 cm similar to the accretion disc radius Rd ~ 5.7 × 1010 cm. In the following we assume that RADC = Rd ~ 5.7 × 1010 cm. Considering the ADC as an extended optically thin cloud with τC ~ 0.01, we can estimate the averaged electron density ne of the ADC using τC = σTneRADC where σT is the Thomson cross section and RADC is the radius of the accretion disc corona; we obtain that the average electron density in ADC is ne ~ 3 × 1011 cm-3.
The detection of the NS spin period of 0.59 s in X1822-371 (Jonker & van der Klis 2001) also supports a scenario in which an extended optically thin corona is present. Indeed, if we assume that the extended corona is optically thick and the observed Comptonised spectrum comes from the extended corona, then the extended corona should have an optical depth of τ = 20, as observed in our fits. The unscattered photons fraction, F = F0e − τ, should be extremely small because of τ ≃ 20. All photons in the corona should be scattered with a number of steps to escape of N = max(τ,τ2) ≃ τ2 (for τ ≫ 1) and their travelled space should be Nλ = τ2λ, where λ is the mean free path of the photons. For an optically thick ADC with RADC = 5.7 × 1010 cm and τ ≃ 20 we find ne ≃ 5 × 1014 cm-3, λ ≃ 3 × 109 cm, the average delay of the escaping photons td = τ2λ/c ≃ 40 s, and, finally, the spread in the arrival times of the coherent photons Δt = τλ/c ≃ 2 s. Note that Δt is almost three times the observed pulse period of X1822-371 (that is 0.59 s), suggesting that a scenario with an extended optically thick corona in X1822-371 is not viable because the ADC should wash out coherent pulsations and prevent the observation of the 0.59 s pulse period. On the other hand, our scenario predicts an extended optically thin ADC with an electron density ne ~ 3 × 1011 cm-3 and τC ≃ 0.01; the mean free path of the photons in the ADC is λ ~ 5 × 1012 cm, a factor 40 larger than the orbital separation of the system, in agreement with the fact that most photons are not scattered in the corona. We expect that only 1% of the photons are scattered in ADC, the escaping photons are scattered once at most and the average delay of the escaping photons is τλ/c ≃ 2 s, similar to the optically thick case. However, because of the absence of self-occultation in ADC, the spread in the arrival times of coherent photons depends on the travelled length l in ADC. In the worst case, for photons scattered in the outer region of the ADC, l = RADC then Δtmax = RADC/c ~ 2 s, while for photons scattered in inner regions of the ADC, for example at R = 1010 cm, we find Δt = 0.3 s, which allows us to observe the 0.59 s pulse period, although with a reduced rms amplitude. and part of this emission is scattered along the line of sight We note that the 1% scattered emission coming from the innermost region is additionally shielded by the outer disc, as discussed in the previous section. Finally, the different fluxes measured during the XMM and Chandra observation can be ascribed to a slightly different optical depth of the scattering corona or shielding from the outer disc rather than to an intrinsic variation of the source luminosity that constantly emits at the Eddington limit (see Burderi et al. 2010).
4.3. Presence of neutral matter around the binary system
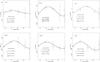 |
Fig. 10 Best-fit parameters of the Doppler modulation associated with the O vii, Ne ix, Ne x, Mg xi, Mg xii, and Si xiv emission lines adopting a sinusoidal function as discussed in the text. Uncertainties are at 68% c.l. |
We detected the presence of local neutral matter that partially covers the X-ray scattering ADC. We found that the local neutral matter has an equivalent hydrogen column of around 5 × 1022 cm-2 and a covering fraction of 60–65%.
We propose that a large part of the outflowing matter is responsible for the partial occultation of the extended X-ray scattering ADC, and suggest that the accreting matter above the Eddington threshold is radiatively expelled from the system at the inner Lagrangian point. Indeed, as estimated by Burderi et al. (2010), only the 20% of the mass transferred from the companion star accretes onto the neutron star of 1.4 M⊙. We report below our estimation on the equivalent hydrogen column associated with the local neutral matter considering the mass continuity equation: 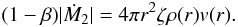 (1)In Eq. (1), β is the fraction of matter from the companion star that accretes onto the compact object, Ṁ2 is the rate of mass transfer from the companion star, ζ is a parameter that takes into account a non-spherical distribution of matter, ρ(r) and v(r) are the density and speed of the matter at a given radius. The speed of the matter will be faster than the escape speed vesc(r), and hence v(r) = ηvesc(r) with η a parameter larger than 1.
We know that the escape speed can be roughly written for a distance r ≫ a (with a orbital separation of the binary system) as ![\begin{equation} v_{\rm esc}(r) = \left[2\frac{G (M_1+M_2)}{r}\right]^{1/2}, \label{eq2} \end{equation}](/articles/aa/full_html/2013/01/aa15305-10/aa15305-10-eq581.png) (2)where M1 and M2 are the masses of the neutron star and companion star, respectively, and G is the gravitational constant. Combining Eq. (2) with (1), we obtain
(2)where M1 and M2 are the masses of the neutron star and companion star, respectively, and G is the gravitational constant. Combining Eq. (2) with (1), we obtain  (3)where ṁ2E is the mass transfer rate from the companion star in units of Eddington mass accretion rate and m1 and m2 are the masses of the neutron star and companion star in units of solar masses. We obtain the particle density n from Eq. (3) by dividing the density ρ by the proton mass and taking into account an appropriate fully ionised cosmic mixture of gases (μ = 0.615):
  (4)From the third Kepler law, the orbital separation a is
 where Ph is the orbital period in units of hours. We can rewrite Eq. (4) as
  (5)Burderi et al. (2010) reported a value of β ≃ 0.18 and ṁ2E ≃ 5.5 for a neutron star mass of 1.4 M⊙. The orbital period of X1822-371 is Ph ≃ 5.57, therefore we derive
 Supposing a constant particle density along the line of sight, we can determine the equivalent hydrogen column N associated with the neutral matter using N = n(a) × a, where a ≃ 1.3 × 1011 cm for X1822-371, that is
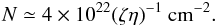 This value is similar to the equivalent hydrogen column of the cold matter that partially occults the central region ( ≃ 5 × 1022 cm-2) under the hypothesis that the product ζη is close the unity. This agrees with our scenario, as ζ takes into account the non-spherical distribution of matter and assumes values lower than 1, while η is a parameter that indicates the speed of the matter in units of the escape speed, the lowest possible speed under the hypothesis that the matter leaves the binary system. The presence of matter in the outer region of the disc or in a region surrounding the entire system was also proposed by Harlaftis et al. (1997) and Cowley et al. (2003), observing that the Hα line is formed in a region not strongly eclipsed and that the Hα velocity variation is very small. These results were confirmed recently by Peris & Dil Vrtilek (2012).
4.4. The ionised matter
We detected ionised emission lines associated with He-like and H-like ions that are O vii, O viii, Ne ix, Ne x, Mg xi, Mg xii, Si xiii, Si xiv, and Fe xxvi. The Ne ix line is identified with the intercombination line during all orbital phases except for that during the eclipse (phase interval 0.95–1.04) when it is identified with the resonance line. We found that all the observed emission lines are clearly detected during the orbital phases between 0.04 and 0.75. At the phase interval 0.75–0.95 we clearly detected the O vii and O viii in the RGS spectrum, of the neutral/partially-ionised iron line in the HETGS and EPIC-pn spectra, and, finally, of the Fe xxvi line in the Epic-pn spectrum; the other lines have a significance lower than 3σ that does not allow us to state with certainty whether they are present at those orbital phases even though the small associated errors with the line energies (which are all compatible with the expected rest-frame energies) suggest their presence. At the eclipse (phase-interval 0.95–1.04) only the O vii line and the neutral/partially-ionised iron line are clearly identified in the RGS and EPIC-pn spectrum, respectively.
 |
Fig. 11 Best-fit values of the parameters vsyst (left panel), K (middle), and φ0 (right panel) for the Ne ix, Ne x, Mg xi, Mg xii, and Si xiv lines. Uncertainties are at 68% c.l. |
The same emission lines were already observed by Cottam et al. (2001), who analysed a shorter Chandra observation. However, because of the poorer statistics, the lines were observed only during the phases 0–0.5. Cottam et al. (2001) suggested that the lines originate from the inner face of the bulge at the outer radius of the accretion disc, where the stream of accreting matter impacts the outer region of the disc. During the phases 0–0.5 we directly observed the inner face of the bulge, whereas in the phase-interval 0.5–1 the lines are not observed because the bulge is facing the opposite direction with respect to the observer.
Best-fit parameters of the Doppler-shift modulation of the most prominent emission lines.
We report the equivalent widths of the most prominent lines at different phases in Table 7. The equivalent widths of the emission lines associated with O viii, Ne ix, Ne x, Mg xi, Mg xii, and Si xiv do not show significant changes at the phase intervals where they are clearly detected, implying that the line and continuum fluxes change in the same way. The equivalent width of the O vii seems to show a reduction at phase 0.75–0.95, and the equivalent width of the Fe xxvi line does not vary along the orbit, although we have no clear detection of this line during the eclipse and more investigations at this phase interval are needed; however, this line cannot originate in the same region of the bulge because it has largest associated ionisation parameter with respect the other lines.
The He-like triplets of O vii, Ne ix, and Mg xi show that the intercombination lines are dominant with respect to the forbidden and resonance lines at all phases. In the following we report our plasma diagnostics using the best-fitting values obtained from the averaged spectrum, because they provide the best constraints. From the line intensities of the O vii triplet, we infer that the origin of the lines is a photoionised plasma with an electron density ne higher than 1012 cm-3 (see the bottom right panel in Fig. 11 in Porquet & Dubau 2000). Our analysis indicates that the R parameter (ratio of the forbidden over intercombination line intensity) is R < 0.2 for O vii, Ne ix and Mg xi, suggesting a plasma density > 1012 cm-3 for O vii, > 1013 cm-3 for Ne ix, and > 1014 cm-3 for Mg xi (see Porquet & Dubau 2000). Assuming that the Ne ix and Mg xi are produced in the bulge, we derive that the bulge has an electron density ne > 1014 cm-3.
Kallman & Bautista (2001) studied the properties of a photoionised plasma at high density (1016 cm-3) and derived that the ionisation parameter ξ is between 100 and 400 for Ne ix, Ne x, Mg xi, Mg xii, and Mg xii and Si xiv, respectively, and ξ ≃ 1000 for Fe xxvi. We can estimate the electron density of the photoionised plasma using the relation ξ = LX/(ner2) (see Krolik et al. 1981), where LX is the X-ray luminosity of the source, ξ the ionisation parameter, ne the electron density of the matter, and r the distance of the photoionised matter from the central source. Adopting an X-ray luminosity of 2 × 1038 erg/s, and placing the bulge at 6 × 1010 cm (the outer radius of the accretion disc), we derive an electron density ne ≃ 5 × 1014 cm-3 that is compatible with the value of ne > 1014 cm-3 estimated above from the study of the triplets.
To estimate the temperature of the emitting plasma we use the G parameter inferred in Sect. 3.2, which is  ,
,  , and
, and  for O vii, Ne ix and Mg xi, respectively. According to the calculations outlined in Porquet & Dubau (2000), we determine that the temperature of the plasma should be <5 × 10⁵ K, < 8 × 10⁵ K, and < 106 K for O vii, Ne ix and Mg xi, respectively. Cottam et al. (2001) detected a RRC feature associated with Ne ix with a temperature of 13 ± 7 eV corresponding to a plasma temperature of (1.5 ± 0.8) × 105 K. We looked for a similar feature in our HETGS observation and found only an upper limit to the plasma temperature of 14 eV corresponding to 1.6 × 10⁵ K. We conclude that the region where the Ne ix, Ne x, Mg xi, Mg xii, and Mg xii and Si xiv lines originate has an electron density of ne ≃ 5 × 1014 cm-3 and a temperature of ~ 1.6 × 10⁵ K.
Recently, Ji et al. (2011), analysing the same Chandra data sets as used for this work, measured a Doppler-shift of several lines. Ji et al. (2011) divided the folded light curve into 40 phase-intervals (separated by 0.025 in phase) and adopted a phase window of 0.16 width in phase, sliding along the 40 intervals from which they extracted the spectra. In this paper we follow a different approach, obtaining information about the lines from the five independent phase-intervals discussed above. Below we present the Doppler-shift velocities of the O vii line observed with the RGS instrument, and of the Ne ix, Ne x, Mg xi, Mg xii, and Si xiv lines observed with the HETGS instruments. We estimate the Doppler-shift velocities of the O vii, Ne ix, Ne x, Mg xi, Mg xii, and Si xiv lines for each phase-interval using the best-fit values of the line energies obtained from RGS data for the O vii line and from HETGS data for the other lines, using the best-fit values of the line energies shown in Table 6. This analysis was not possible for the O viii line because of larger uncertainties.
To estimate the Doppler-shift modulations we fitted the Doppler-shift velocities, vshift, obtained for each phase-interval using the relation  (6)where the free parameters are vsyst, the systemic velocity in units of km s-1, K, the semi-amplitude velocity in units of km s-1, and φ0, the orbital phase at which the sinusoidal function is null. The orbital period P in units of phase is kept fixed to 1. The best-fit parameters for each line are shown in Table 8.
Initially, we focus our attention on the sinusoidal modulation of the Ne ix, Ne x, Mg xi, Mg xii, and Si xiv lines; the best-fit values of vsyst, K, and φ0 are similar for all these lines, suggesting that these five lines are probably produced in the same region. We plot the obtained best-fit parameters of the sinusoidal modulation in Fig. 11 (left, middle, and right panel, respectively). Under the assumption that the emitting region is the same for the five lines, we fit their values of vsyst, K, and φ0 using a constant and finding self-consistent results. We obtain in this way the following average values: vsyst = −107 ± 41 km s-1 and χ2(d.o.f.) = 4.5(4), K = 339 ± 53 km s-1 and χ2(d.o.f.) = 0.25(4), and, finally, φ0 = 0.23 ± 0.03 and χ2(d.o.f.) = 6.1(4).
The systemic velocity, vsyst, is similar for the five lines with a value of vsyst = −107 ± 41 km s-1 (see Fig. 11, left panel), which is compatible with the systemic velocity of –106 km s-1 and –101 km s-1 obtained by Cowley et al. (2003) for the He ii λ4686 and Hα lines observed in X1822-371.
The values of φ0 obtained for the five lines are similar, and fitting them with a constant, we obtain φ0 = 0.23 ± 0.03 and a  , which is acceptable. We find that the emitting region has null radial velocity at phases 0.23 ± 0.03 and 0.73 ± 0.03 which is when the radial velocity changes from negative to positive and from positive to negative values, respectively. The detection of a Doppler modulation implies that the Ne ix, Ne x, Mg xi, Mg xii, and Si xiv lines are produced in a compact region in the bulge at the outer accretion disc, as suggested by Cottam et al. (2001). Moreover, the phases between 0.6 and 0.9 correspond to the minimum of the modulation out of the eclipse in the light curve (see Fig. 2), which is when the outer accretion disc is the tallest and, consequently, when the scattered emission is mostly occulted by the outer disc. Our results suggest that the outer region of the disc with the largest height and the bulge is the same region as the one that covers a phase interval longer than 0.3; while the region where the Ne ix, Ne x, Mg xi, Mg xii, and Si xiv lines are produced might be (a part of) the bulge illuminated by the central source.
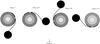 |
Fig. 12 Illustration of the geometry of X1822-37. The figure is to scale except for the size of the region in the bulge where the O viii, Ne ix, Ne x, Mg xi, Mg xii, and Si xiv lines originate (white circle). The black-coloured arc at the outer radius of the disc indicates where the outer disc is the highest, which is the location of the bulge. The dashed and dotted circumferences on the disc indicate where the O vii and Fe i-Fe xv lines are produced, respectively. |
We show the inferred geometry of X1822-371 in Fig. 12; the region in the bulge where the lines originate (indicated with a white circle) is not to scale because its size is uncertain. Adopting the estimate of the solid angle subtended by this region inferred by Cottam et al. (2001) and the outer radius of the disc (6 × 1010 cm) estimated above, we find an illuminated surface area of ~8.3 × 1020 cm2. Assuming, arbitrarily, that the height h and the subtended arc l of the illuminated region have the same size, we find h = l ~ 3 × 1010 cm; the subtended angle in this case is ~28° corresponding to a phase interval of 0.07 that is shorter than that subtended by the whole bulge, which is 0.3. On the other hand, assuming that the whole inner face of the bulge is illuminated by the central source, we estimate that the vertical scale height is h ~ 7.3 × 109 cm. Using detailed modelling of the X-ray, UV, optical, and IR light curves, White & Holt (1982), Mason & Cordova (1982), and Hellier & Mason (1989) all inferred a phase-dependent vertical structure along the outer radius of the disc that is dominated by the bulge with a maximum vertical height between 0.6 and 1.6 × 1010 cm depending on the model. This is consistent with the vertical height that we estimate assuming that the whole inner face of the bulge emits the observed lines, while a discrepancy of a factor 2 is obtained for the first case (h ≃ l).
At phase 0.73 the outer part of the illuminated compact region is facing the observer and changes its radial velocity from positive to negative values. At the same phase the outer region of the disc is the tallest and occults a large part of the direct emission coming from the inner disc surface. The black-coloured arc at the outer radius of the disc shown in Fig. 12 indicates where the outer disc is the tallest, that is the whole size of the bulge.
The semi-amplitude velocities are very similar for the five lines, we find K = 339 ± 53 km s-1 (see Fig. 11, middle panel) with a χ2(d.o.f.) = 0.25(4). The maximum of the blueshift velocities (~360 km s-1) is observed at phases between 0.45 and 0.51 and is compatible with the value inferred by Cottam et al. (2001), who deduced a blueshift velocity of ~360 km s-1 at phase 0.50 and suggested that we are observing the line emissions from the bulge that was expected to form in the shock-heated, colliding material (see e.g. Livio et al. 1986). Our results suggest that the lines associated with the Ne ix, Ne x, Mg xi, Mg xii, and Si xiv transitions are produced in the bulge illuminated by the central source.
The O vii line does not show a significant sinusoidal modulation. We obtain that K = 77 ± 121 km s-1 and the probability of chance improvement with respect to a constant is only 52.6%. The flux and the equivalent width of this line drop during the phase interval 0.75–0.95 (see Tables 6 and 7). These arguments suggest that the O vii line is produced in a different region. Because the equivalent width of the O vii line drops at phases between 0.75 and 0.95, we argue that at those phases its emitting region is occulted by the bulge and the outer disc, implying that the O vii line is produced in an inner region with respect to the other ionised lines. We can speculate that the O vii line is produced on the accretion disc surface illuminated by the central source. The half width at half maximum (HWHM) of the line O vii corresponds to a velocity of about 680 ± 130 km s-1, and, consequently, to an accretion disc radius of  cm. We estimate the electron density of the photoionised plasma assuming a luminosity at the Eddington limit (2 × 1038 erg s-1) using the relation ξ = LX/(ner2) and obtain a plasma density of about 1.3 × 1016 cm-3, which agrees with our estimation from the study of the O vii triplet that ne is larger than 1012 cm-3. The radius where the O vii line originates is comparable with the companion star radius (that is 3.7 × 1010 cm), which explains why the equivalent width of the O vii line drops at phases between 0.75 and 0.95 and increases again during the eclipse. Indeed, at phases 0.75–0.95, the bulge is interposed between the central source and the observer and its large azimuthal extension covers the region of the disc that emits the line, while during the eclipse this region is only marginally occulted by the companion star. The O vii line is clearly detected in the RGS spectrum along the whole orbital period. Because we observe this line at phase interval 0.75–0.95, it is probable that we are observing both direct and scattered line photons of O vii. Indeed, if we had observed only the direct line photons, we should not have detected the O vii line at this phase interval.
Furthermore, even if the emission lines associated with the Ne ix, Ne x, Mg xi, Mg xii, and Si xiv transitions are not clearly detected in the phase interval 0.75–0.95, we tentatively suggest that we are observing both direct and scattered emission from the illuminated region of the bulge; this scenario seems reasonable considering that the optically thin extended corona extends to the outer disc, implying that even when the outer face of the bulge is orientated towards the observer, we expect that part of the emission from the illuminated region is scattered into the line of sight by the extended optically thin corona. However, more investigations with observations with larger statistics are needed to confirm this scenario.
We show in Fig. 12 the geometry of X1822-371 at phase 0 (during the eclipse) and at phase 0.73 (when the shielding by the bulge is maximum); during the eclipse the companion star occults the region of the disc where the O vii line was produced (indicated with a dashed circumference in Fig. 12) less than the bulge occults the same region at phase 0.73.
We were unable to estimate the Doppler motion associated with the O viii emission line because of the large errors associated with its centroid energy. However, we suggest that this line is produced in the illuminated face of the bulge for two reasons: 1) its equivalent width does not change along the orbital phase (see Table 7) similarly to the equivalent width of the Ne ix, Ne x, Mg xi, Mg xii, and Si xiv emission lines; 2) the ionisation parameter of the O viii is near 100 (see Kallman & Bautista 2001), similar to that obtained for the lines produced in the bulge (i.e. between 100 and 400).
The Fe xxvi emission line does not show Doppler modulation. Initially, we fitted its Doppler-shift velocities with a constant and then with a sinusoidal function, obtaining a probability of chance improvement of only 60%. The corresponding equivalent width is constant at the phases 0.04–0.95 and, during the eclipse, it shows an upper limit compatible with the values obtained at the other phases (see Table 7). We have only a marginal detection of the Fe xxvi emission line during the eclipse. In agreement with Ji et al. (2011), we argue that this line may be produced at r < 3.7 × 1010 cm (i.e. the size of the Roche lobe radius of the companion star).
4.5. The neutral/partially ionised iron line
We find an emission line at 6.4 keV in HETGS and Epic-pn spectra, consistent with fluorescent emission from Fe i-Fe xv (Kallman et al. 2004) with an ionisation parameter ξ ≤ 10, similar to the one associated with O vii. The broadening of the line at 6.4 keV is 18 ± 3 eV as measured by the HETGS (see Table 2). The width obtained from the HETGS data is compatible with the value inferred by Ji et al. (2011).
We do not significantly detect Doppler modulation of this emission line (see Table 7). Its flux is minimum at phases between 0.75–1.04, during the occultation by the bulge and the companion star. This can be explained by assuming that the fluorescence iron line is produced at the surface of the accretion disc similarly to the O vii line, taking also into account that the ionisation parameter is comparable for the two lines. Using the HETGS best-fitting parameters and assuming that the broadening of the neutral iron line is caused by a Keplerian motion of the plasma, we find that it should originate at a distance from the neutron star of  cm, that is at a radius a factor of two smaller than that at which the O vii line is produced. Since the radius of the companion star is 3.7 × 1010 cm, the emitting region of the iron line is occulted both during the eclipse (phase 0) and during the occultation by the opaque shield (phase 0.73). We show in Fig. 12 the radius where the fluorescence iron line is produced with a dotted circumference.
5. Conclusions
We analysed one XMM-Newton observation and two Chandra observations of X1822-371. We found that the continuum emission is well-fitted using a Comptonised component partially absorbed by local neutral matter. In the following we summarise our results:
-
We inferred the presence of an extended optically thin corona. The Comptonised component, with electron temperature of 3 keV and optical depth of 20, is produced in a compact region near the neutron star. In line with the work of Burderi et al. (2010), we assume that the intrinsic luminosity is 2 × 1038 erg/s (the Eddington luminosity for a neutron star of 1.4 M⊙) although the observed luminosity is 1036 erg/s. This discrepancy is caused by the high system inclination and by the geometrically thick outer accretion disc that occults the innermost region. We observed only the emission that is scattered into the line of sight by an extended optically thin (τ ≃ 0.01) corona.
-
The partial covering component is due to neutral matter located at a radius larger than the outer disc radius. The fraction of the covered emitting surface is 60% along the whole orbit and the equivalent hydrogen column is between 4.5 and 5 × 1022 cm-2. Since the mass transfer in X1822-371 is not conservative (Burderi et al. 2010; Bayless et al. 2010), we suggest that the local neutral matter could be the matter outflowing from the companion star, which is swept away by the radiation pressure in the proposed scenario.
-
We observed the emission lines associated with Ne ix, Ne x, Mg xi, Mg xii, Si xiii, and Si xiv. These lines show Doppler modulation, suggesting that they are produced in a compact region. In agreement with previous authors, we found that these lines are produced in the inner illuminated face of the bulge at the outer radius of the accretion disc distant 6 × 1010 cm from the NS. The density of the photoionised emitting plasma is ~5 × 1014 cm-3. We detected the O viii emission line in the RGS spectrum at all phase intervals with a marginal detection during eclipse. The large errors on its centroid energy do not allow us to find a clear Doppler modulation of this line. However, the behaviour of its equivalent width, similar to those of the Ne ix, Ne x, Mg xi, Mg xii, Si xiii, and Si xiv lines, and its similar ionisation parameter suggest that the O viii emission line is produced in the illuminated bulge as well.
-
The Fe xxvi line was observed at all phases with a marginal detection during the eclipse. This line has a large ionisation parameter and does not show significant Doppler modulation. In agreement with Ji et al. (2011), we suggest that this line is produced at a distance from the compact object less than 3.7 × 1010 cm.
-
We observed the O vii and a prominent fluorescence iron line that can be associated with Fe i-Fe xv. These lines do not show significant Doppler-modulation and are produced in the photoionised surface of the accretion disc, at
 cm and
  cm, respectively. The O vii emission line is partially occulted only at phases between 0.75–0.95 by the bulge while the fluorescence iron line is occulted also during the eclipse considering that the radius of the companion star is 3.7 × 1010 cm.
The same XMM-Newton dataset analysed in this work has been also discussed by Somero et al. (2012).
Acknowledgments
We are grateful to the anonymous referee for his/her useful suggestions. Authors acknowledge financial contribution from the agreement ASI-INAF I/009/10/0. L.B. and T.D. acknowledge support from the European Community’s Seventh Framework Program (FP7/2007-2013) under grant agreement number ITN 215212 Black Hole Universe. A.P. acknowledges the support by the grants AYA2009-07391 and SGR2009-811, as well as the Formosa program TW2010005 and iLINK program 2011-0303.
References
- Asplund, M., Grevesse, N., Sauval, A. J., & Scott, P. 2009, ARA&A, 47, 481 [NASA ADS] [CrossRef] [Google Scholar]
- Bayless, A. J., Robinson, E. L., Hynes, R. I., Ashcraft, T. A., & Cornell, M. E. 2010, ApJ, 709, 251 [NASA ADS] [CrossRef] [Google Scholar]
- Burderi, L., di Salvo, T., Riggio, A., et al. 2010, A&A, 515, A44 [NASA ADS] [CrossRef] [EDP Sciences] [Google Scholar]
- Cottam, J., Sako, M., Kahn, S. M., Paerels, F., & Liedahl, D. A. 2001, ApJ, 557, L101 [NASA ADS] [CrossRef] [Google Scholar]
- Cowley, A. P., Schmidtke, P. C., Hutchings, J. B., & Crampton, D. 2003, AJ, 125, 2163 [NASA ADS] [CrossRef] [Google Scholar]
- Davis, J. E. 2001, ApJ, 562, 575 [NASA ADS] [CrossRef] [Google Scholar]
- den Herder, J. W., Brinkman, A. C., Kahn, S. M., et al. 2001, A&A, 365, L7 [NASA ADS] [CrossRef] [EDP Sciences] [Google Scholar]
- Frank, J., King, A., & Raine, D. 2002, Accretion power in astrophysics; electronic version, Cambridge Astrophys. Ser. (Cambridge: Cambridge Univ. Press) [Google Scholar]
- Garmire, G. P., Bautz, M. W., Ford, P. G., Nousek, J. A., & Ricker, Jr., G. R. 2003, in SPIE Conf. Ser. 4851, eds. J. E. Truemper, & H. D. Tananbaum, 28 [Google Scholar]
- Harlaftis, E. T., Charles, P. A., & Horne, K. 1997, MNRAS, 285, 673 [NASA ADS] [CrossRef] [Google Scholar]
- Heinz, S., & Nowak, M. A. 2001, MNRAS, 320, 249 [NASA ADS] [CrossRef] [Google Scholar]
- Hellier, C., & Mason, K. O. 1989, MNRAS, 239, 715 [NASA ADS] [CrossRef] [Google Scholar]
- Iaria, R., Di Salvo, T., Burderi, L., & Robba, N. R. 2001, ApJ, 557, 24 [NASA ADS] [CrossRef] [Google Scholar]
- Iaria, R., di Salvo, T., Burderi, L., et al. 2011, A&A, 534, A85 [NASA ADS] [CrossRef] [EDP Sciences] [Google Scholar]
- Jain, C., Paul, B., & Dutta, A. 2010, MNRAS, 409, 755 [NASA ADS] [CrossRef] [Google Scholar]
- Jansen, F., Lumb, D., Altieri, B., et al. 2001, A&A, 365, L1 [NASA ADS] [CrossRef] [EDP Sciences] [Google Scholar]
- Ji, L., Schulz, N. S., Nowak, M. A., & Canizares, C. R. 2011, ApJ, 729, 102 [NASA ADS] [CrossRef] [Google Scholar]
- Jonker, P. G., & van der Klis, M. 2001, ApJ, 553, L43 [NASA ADS] [CrossRef] [Google Scholar]
- Jonker, P. G., van der Klis, M., & Groot, P. J. 2003, MNRAS, 339, 663 [NASA ADS] [CrossRef] [Google Scholar]
- Kallman, T., & Bautista, M. 2001, ApJS, 133, 221 [NASA ADS] [CrossRef] [Google Scholar]
- Kallman, T. R., Palmeri, P., Bautista, M. A., Mendoza, C., & Krolik, J. H. 2004, ApJS, 155, 675 [NASA ADS] [CrossRef] [Google Scholar]
- Krolik, J. H., McKee, C. F., & Tarter, C. B. 1981, ApJ, 249, 422 [NASA ADS] [CrossRef] [Google Scholar]
- Livio, M., Soker, N., & Dgani, R. 1986, ApJ, 305, 267 [NASA ADS] [CrossRef] [Google Scholar]
- Mason, K. O., & Cordova, F. A. 1982, ApJ, 255, 603 [NASA ADS] [CrossRef] [Google Scholar]
- McClintock, J. E., London, R. A., Bond, H. E., & Grauer, A. D. 1982, ApJ, 258, 245 [NASA ADS] [CrossRef] [Google Scholar]
- Parmar, A. N., Oosterbroek, T., Del Sordo, S., et al. 2000, A&A, 356, 175 [NASA ADS] [Google Scholar]
- Peris, C., & Dil Vrtilek, S. 2012, MNRAS, 427, 1043 [NASA ADS] [CrossRef] [Google Scholar]
- Porquet, D., & Dubau, J. 2000, A&AS, 143, 495 [NASA ADS] [CrossRef] [EDP Sciences] [Google Scholar]
- Somero, A., Hakala, P., Muhli, P., Charles, P., & Vilhu, O. 2012, A&A, 539, A111 [NASA ADS] [CrossRef] [EDP Sciences] [Google Scholar]
- Strüder, L., Briel, U., Dennerl, K., et al. 2001, A&A, 365, L18 [NASA ADS] [CrossRef] [EDP Sciences] [Google Scholar]
- Turner, M. J. L., Abbey, A., Arnaud, M., et al. 2001, A&A, 365, L27 [NASA ADS] [CrossRef] [EDP Sciences] [Google Scholar]
- White, N. E., & Holt, S. S. 1982, ApJ, 257, 318 [NASA ADS] [CrossRef] [Google Scholar]
All Tables
Best-fit values of the continuum parameters as a function of the orbital phase of X1822-371.
Best-fit parameters of the Doppler-shift modulation of the most prominent emission lines.
All Figures
|
Fig. 1 First-order MEG+HEG light curves of X1822-371. The light curves correspond to Obs. ID. 9076 (left panel) and 9858 (right panel), respectively. The bin time is 100 s for both light curves. |
| In the text | |
|
Fig. 2 Folded light curves corresponding to Obs. ID. 9076 (left panel) and Obs. ID. 9858 (right panel). The data were folded adopting the X-ray ephemeris obtained by Iaria et al. (2011) and using 128 channels per period. The vertical lines indicate the phase intervals used for the phase-dependent spectral analysis (see Sect. 3.3). |
| In the text | |
|
Fig. 3 RGS1 background light curve (left panel) and Epic-pn background light curve (right panel). The horizontal segments indicate the time interval excluded from our analysis. The bin time is 100 s. |
| In the text | |
|
Fig. 4 Upper (middle) panel: Epic-pn 1–3 keV (3–10 keV) folded light curves. Lower panel: Epic-pn hardness ratio for the two energy-selected light curves shown above. The data were folded adopting the recent X-ray ephemeris obtained by Iaria et al. (2011) and using 256 channels per period. |
| In the text | |
|
Fig. 5 Data and residuals of RGSs and Epic-pn spectra. Second panel from the top: residuals using the model phabs*(f*cabs*phabs*(CompTT)+(1-f)*CompTT). Third panel from the top: residuals adding nine Gaussian components to the previous model to fit the lines. Bottom panel: residuals adding a black-body component to the model. |
| In the text | |
|
Fig. 6 Residuals of first-order MEG (black points) and HEG (red points) spectra using the continuum shown in the text. The emission lines are indicated in the panels. |
| In the text | |
|
Fig. 7 Forbidden (green), intercombination (blue), and resonance (red) lines of the O vii, Ne ix and Mg xi triplets. From top to bottom: RGS1 data and residuals of the O vii triplet; first-order MEG data and residuals of the O vii triplet; first-order MEG data and residuals of the Ne ix triplet; first-order MEG data and residuals of the Mg xi triplet. |
| In the text | |
|
Fig. 8 Parameters of the Comptonised component obtained fitting the XMM data: electron temperature (top), optical depth (middle), and the unabsorbed flux in units of 10-10 erg s-1 cm-2 (bottom) in the 0.4–12 keV energy band, the open squares and the dots are the values obtained from the Chandra and XMM spectra, respectively. |
| In the text | |
|
Fig. 9 Best-fit values of the equivalent hydrogen column density associated with the local neutral matter (upper panel) and the fraction f of the emitting region covered by local neutral matter (lower panel). |
| In the text | |
|
Fig. 10 Best-fit parameters of the Doppler modulation associated with the O vii, Ne ix, Ne x, Mg xi, Mg xii, and Si xiv emission lines adopting a sinusoidal function as discussed in the text. Uncertainties are at 68% c.l. |
| In the text | |
|
Fig. 11 Best-fit values of the parameters vsyst (left panel), K (middle), and φ0 (right panel) for the Ne ix, Ne x, Mg xi, Mg xii, and Si xiv lines. Uncertainties are at 68% c.l. |
| In the text | |
|
Fig. 12 Illustration of the geometry of X1822-37. The figure is to scale except for the size of the region in the bulge where the O viii, Ne ix, Ne x, Mg xi, Mg xii, and Si xiv lines originate (white circle). The black-coloured arc at the outer radius of the disc indicates where the outer disc is the highest, which is the location of the bulge. The dashed and dotted circumferences on the disc indicate where the O vii and Fe i-Fe xv lines are produced, respectively. |
| In the text | |
Current usage metrics show cumulative count of Article Views (full-text article views including HTML views, PDF and ePub downloads, according to the available data) and Abstracts Views on Vision4Press platform.
Data correspond to usage on the plateform after 2015. The current usage metrics is available 48-96 hours after online publication and is updated daily on week days.
Initial download of the metrics may take a while.